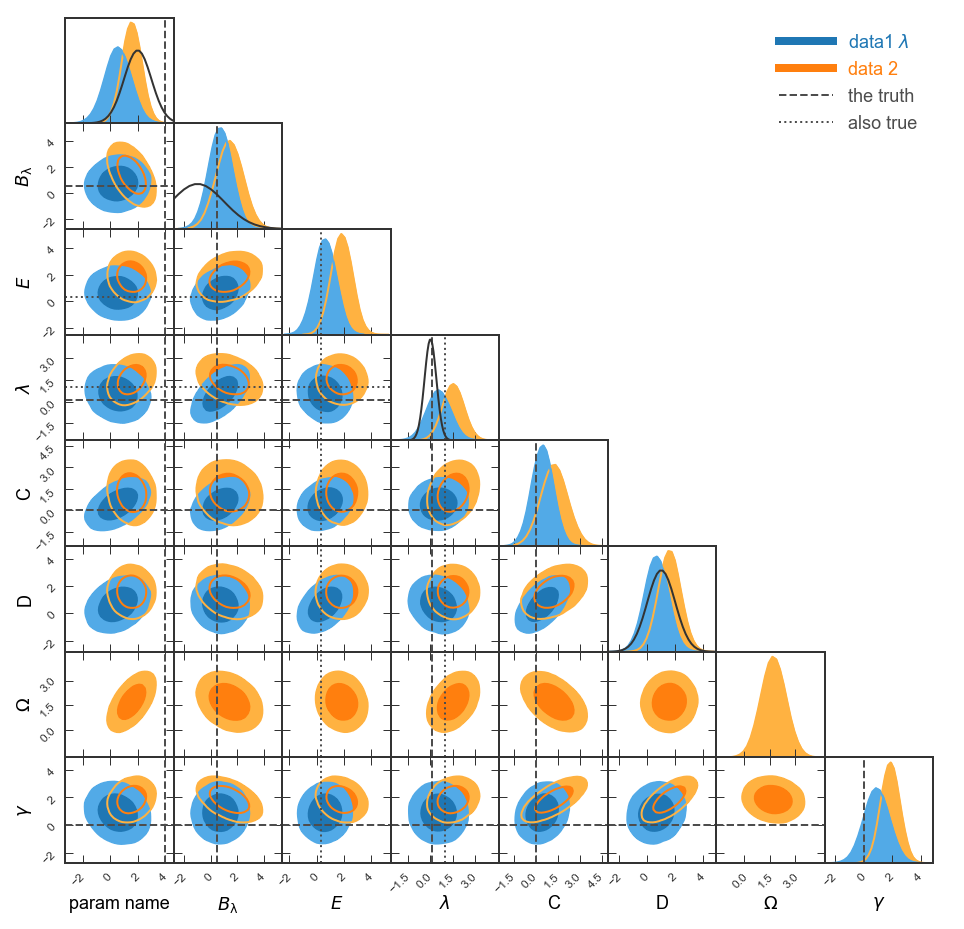
What is a Giant Triangle Confusogram?
A Giant-Triangle-Confusogram (GTC, aka triangle plot) is a way of
displaying the results of a Monte-Carlo Markov Chain (MCMC) sampling or similar
analysis. (For a discussion of MCMC analysis, see the excellent emcee
package.) The recovered parameter constraints are displayed on a grid in which
the diagonal shows the one-dimensional posteriors (and, optionally, priors) and
the lower-left triangle shows the pairwise projections. You might want to look
at a plot like this if you are fitting a model to data and want to see the
parameter covariances along with the priors.
Here's an example of a GTC with some random data and arbitrary labels:
pygtc.plotGTC(chains=[samples1,samples2],
              paramNames=names,
              chainLabels=chainLabels,
              truths=truths,
              truthLabels=truthLabels,
              priors=priors,
              paramRanges=paramRanges,
              figureSize='MNRAS_page')
But doesn't this already exist in corner.py, distUtils, etc...?
Although several other packages exists to make such a plot, we were unsatisfied
with the amount of extra work required to massage the result into something we
were happy to publish. With pygtc, we hope to take that extra legwork out of
the equation by providing a package that gives a figure that is publication
ready on the first try! You should try all the packages and use the one you like
most; for us, that is pygtc!
For a quick start, you can install with either pip or conda. Either will install the required
dependencies for you (packaging, numpy, and matplotlib):
$ pip install pygtc
or, if you use conda:
$ conda install pygtc -c conda-forge
For more installation details, see the documentation.
Documentation is hosted at ReadTheDocs. Find an exhaustive set of examples there!
If you use pygtc to generate plots for a publication, please cite as:
@article{Bocquet2016,
  doi = {10.21105/joss.00046},
  url = {http://dx.doi.org/10.21105/joss.00046},
  year  = {2016},
  month = {oct},
  publisher = {The Open Journal},
  volume = {1},
  number = {6},
  author = {Sebastian Bocquet and Faustin W. Carter},
  title = {pygtc: beautiful parameter covariance plots (aka. Giant Triangle Confusograms)},
  journal = {The Journal of Open Source Software}
}
Copyright 2016, Sebastian Bocquet and Faustin W. Carter
