A nosey, agentless, easy monitoring tool over SSH.
Warning: Heavy WIP!
It's an answer when you found usual monitoring systems too heavy and complex.
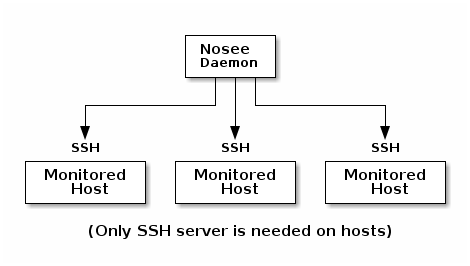
Nosee uses SSH protocol to execute scripts on monitored systems, checking for whatever you want. The result is evaluated and Nosee will ring an alert of your choice if anything is wrong.
In short : SSH, no agent, simple configuration, usual scripting.
Currently, Nosee requires bash on monitored hosts. It was successfully tested with Linux (of course) but using Cygwin sshd on Windows hosts too.
The Nosee daemon itself can virtually run with any Go supported platform.
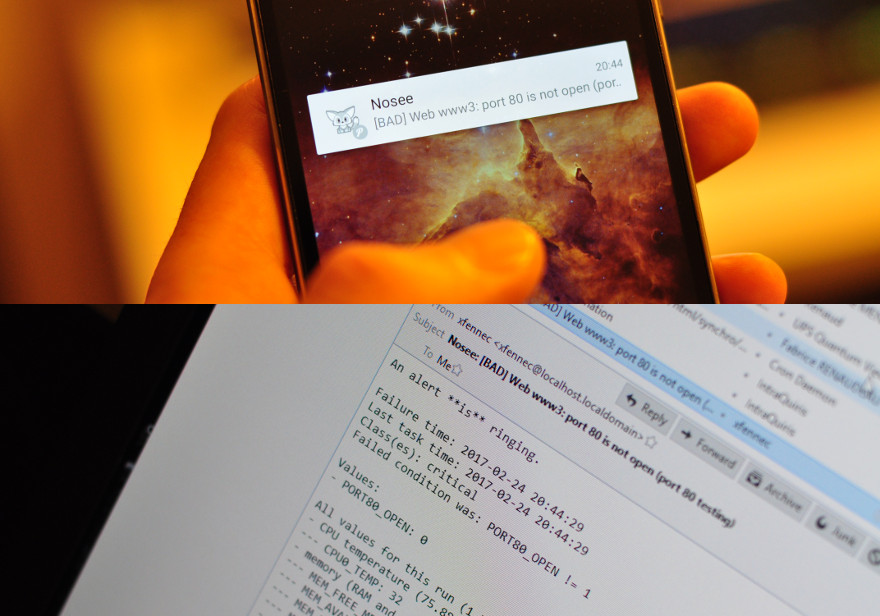
Here is an alert triggered by a "port connection testing" probe. This alert
is then configured to be sent using mail and a HTTP request to Pushover
for realtime mobile device notification.
You can also have a look at the Nosee-console project, it provides a cool Web monitoring interface.
If you have Go installed:
go get github.com/Xfennec/nosee
You will then be able to launch the binary located in you Go "bin" directory.
(since Go 1.8, ~/go/bin if you haven't defined any $GOPATH)
The project is still too young to provide binaries. Later. (and go get is so powerful…)
As a reminder, you can use the -u flag to update the project and its dependencies if
you don't want to use git for that.
go get -u github.com/Xfennec/nosee
You may have a look at the "template" configuration directory
provided in $GOPATH/src/github.com/Xfennec/nosee/etc as a more complete
example or as a base for the following tutorial. (edit hosts.d/test.toml
for connection settings and alerts.d/mail_general.toml for email address,
at least)
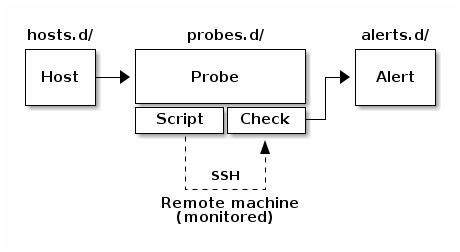
Here's a general figure of how Nosee works:
Configuration is mainly done by simple text file using the TOML syntax.
Let's monitor CPU temperature of one of our Web servers.
Create a file in the hosts.d directory. (ex: hosts.d/web_myapp.toml).
name = "MyApp Webserver"
classes = ["linux", "web", "myapp"]

[network]
host = "192.168.0.100"
port = 22

[auth]
user = "test5"
password = "test5"
The classes parameter is completely free, you may chose anything that
fits your infrastructure. It will determine what checks will be done on
this host (see below).
Authentication by password is extremely bad, of course, as writing down a password in a configuration file. Nosee supports other (preferred) options such as passphrases and ssh-agent.
Create a file in the probes.d directory. (ex: probes.d/cpu_temp.toml).
name = "CPU temperature"
targets = ["linux"]

script = "cpu_temp.sh"

delay = "1m"

# Checks

[[check]]
desc = "critical CPU temperature"
if = "TEMP > 85"
classes = ["critical"]
The targets parameter will match the classes of our host. Targets can
be more precise with things like linux & web. (both linux and web classes
must exist in host)
The delay explains that this probe must be run every minute. This is
the lowest delay available.
Then we have a check. You can have multiple checks in a probe. This check
will look at the TEMP value returned by the cpu_temp.sh
script (see below) and evaluate the if expression. You can have a look
at govaluate for details about
expression's syntax.
If this expression becomes true, the probe will ring a critical alert. Here
again, you are free to use any class of your choice to create your own
error typology. (ex: ["warning", "hardware_guys"] to ring a specific group
of users in charge of critical failures of the hardware)
Scripts are hosted in the scripts/probes/ directory.
#!/bin/bash

val=$(cat /sys/class/thermal/thermal_zone0/temp)
temp=$(awk "BEGIN {print $val/1000}")
echo "TEMP:" $temp
This script will run on monitored hosts (so… stay light). Here, we read the first thermal zone and divide it by 1000 to get Celsius value.
Scripts must print KEY: val lines to feed checks, as seen above. That's it.
Create a file in the alerts.d directory. (ex: alerts.d/mail_julien.toml).
name = "Mail Julien"

targets = ["julien", "warning", "critical", "general"]

command = "mail"

arguments = [
    "-s",
    "Nosee: $SUBJECT",
    "julien@domain.tld"
]
This simple alert will use the usual mail command when an alert matches
one (or more) of the given targets. It works exactly the same as classes/targets
for Hosts/Probes to let you create your own vocabulary.
(ex: "web & production & critical" is a valid target)
As you may have seen, some variables are available for arguments, like
the $SUBJECT of the alert message.
There's a special class general for very important general messages. At
least one alert must listen permanently at this class.
cd $GOPATH/bin
./nosee -l info -c ../src/github.com/Xfennec/nosee/etc/
You are now ready to burn your Web server CPU to get your alert mail. The -c
parameter gives the configuration path, and the -l will make Nosee way
more verbose.
./nosee help
… will tell you more about command line arguments.
Oh yes. I want to explain:
- "threaded" (Goroutines)
- global
nosee.tomlconfiguration - SSH runs (group of probes)
*targets- needed_failures / needed_successes
- defaults
- host overriding of probe's defaults
- use of defaults for probe script arguments
- probe
run_ifcondition - alert scripts
- alert limits
- alert env and stdin
- timeouts
- rescheduling
- GOOD and BAD alerts
- UniqueID for alerts
- configuration "recap/summary" command
- extensive configuration validation (and connection tests)
- alert examples (pushover, SMS, …)
- probe examples!
- check "If" functions (date)
- nosee-alerts.json current alerts
- heartbeat scripts
- systemd / supervisord sample files (see deploy/ directory)
- test subcommand
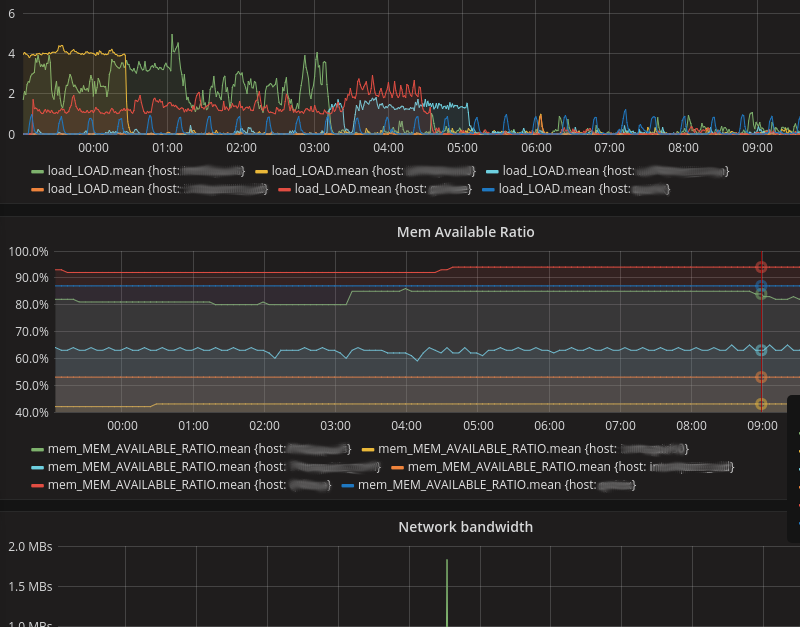
- loggers / InfluxDB
(example: Nosee → InfluxDB → Grafana)
- remote Nosee interconnections


