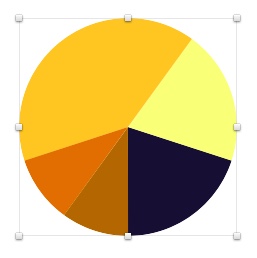
A Sketch plugin to magically convert Circle layers into pie charts!
Download and extract the contents of this repository. Then double-click the Sketchy Pies.sketchplugin bundle to install the plugin. Remember, this will only work if you have Sketch updated to version 3.3 or above.
Using the plugin is easy:
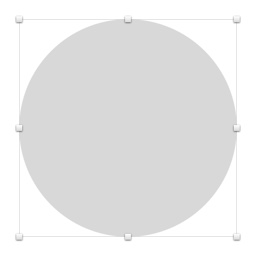
Draw and select a Circle on the canvas or in an artboard.
Run the plugin from the menu Plugins > Sketchy Pies > Convert to Pie Chart.
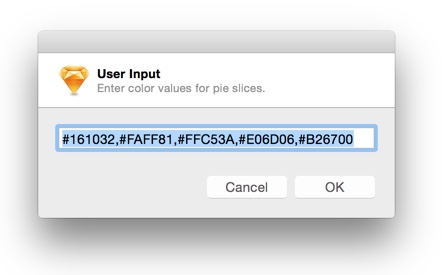
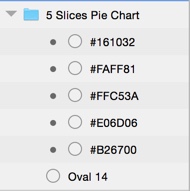
Enter color values for each slice in the Pie Chart, separated by commas.
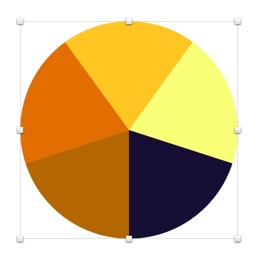
This will create a Pie Chart with equal slices based on the number of color values you added.
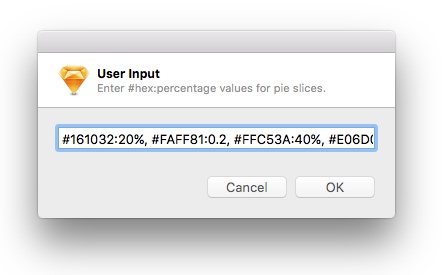
Optionally, you can also specify percent values along with the relative color values. For example, #FF0000:0.5, #0000FF:50%.
This will create a Pie Chart with variable slices based on the percent values and their associated colors.
Each slice of pie will be a separate layer, in case you need to change the colors later.
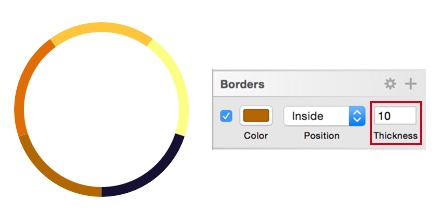
You can select all the pie layers and adjust the border thickness to make donut charts, if that's what you're after.
If Sketchy Pies saved you a few minutes of mundane work, do spend a second to Tweet about it or share on Facebook.
This plugin was inspired by this tweet from @getflourish.
Made by Aby Nimbalkar. I'm on Twitter if you run into any issues with this, or just want to say hello.
