-
-
Notifications
You must be signed in to change notification settings - Fork 837
New issue
Have a question about this project? Sign up for a free GitHub account to open an issue and contact its maintainers and the community.
By clicking “Sign up for GitHub”, you agree to our terms of service and privacy statement. We’ll occasionally send you account related emails.
Already on GitHub? Sign in to your account
Reactive data example not working #122
Comments
|
Can you please provide a minimal reproduction? Codepen or jsfiddle? |
|
You have to pass the mixin as an array ;) mixins: [VueChartJs.mixins.reactiveProp]here is also a working codepen https://codepen.io/apertureless/pen/BZKBdX |
|
Thanks so much for checking this out and providing the codepen. I had the mixin as an array in my code, just not in the fiddle (sorry about that), so that wasn't the issue. Working from your codepen I realized that the issue was that the datacollection variable was initialized as Would you mind confirming that this is the issue? Reactive data cannot be initialized as null. |
|
Hey @kjfdebruin that seem to be the problem. However it actually should work with an empty initial data model. Could be related to #109 Because as far as I remember, it worked with an empty / null data model before. I will digg into it and fix it ASAP. However a temporary fix would be to initialize your data model as an empty object. data () {
return {
datacollection: {}
}
} |
Reactive mixin broke if the initial data was set to null.
|
Hey, this issue is fixed with #135 and will be available with the next release |
|
Hello, I had this issue and initializing the chart-data like @apertureless said was not enough, as I had this error: I fixed it by initializing the chart-data like the following: Empty labels and empty datasets removed that error for me, anyone had the same thing? |


Expected Behavior
Reactive LineChart example from the docs should render the chart on load, and re-render the chart on button click
Actual Behavior
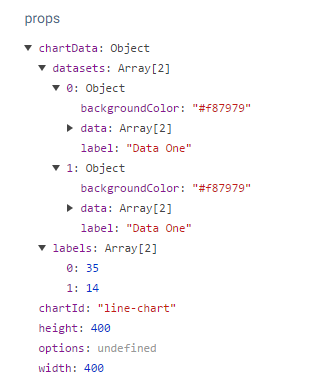
The chart does not render (axes are drawn, but chart area stays blank), even though chartData is populated correctly (as seen with VueJS Chrome plugin).

On click I get:
and
Environment
The text was updated successfully, but these errors were encountered: