This is the Grafana connector for ArangoDB that can be used as data source for the Grafana plugin JSON Data Source. Note that this plugin requires Grafana 8.
First install the JSON Data Source plugin in Grafana following the instructions. You may have to restart Grafana for the new data source to become available.
The Grafana connector can be installed as a Foxx service using the Foxx CLI:
$ npm install --global foxx-cli
$ foxx install -u root -P -H http://COORDINATOR:8529 -D _system /grafana \
https://github.com/arangodb-foxx/grafana-connector/archive/master.zip
or without foxx-cli and instead using npx:
$ npx foxx-cli install -u root -P -H http://localhost:8529 -D _system /grafana \
https://github.com/arangodb-foxx/grafana-connector/archive/master.zip
You can also install using the ArangoDB web interface
Before you can use the ArangoDB connector in Grafana you need to configure the service using the web interface or the Foxx CLI. The following parts need to be configured.
- ArangoDB grafana-connector
- a username / password to access the service in ArangoDB
- the AQL query to extract the timeseries
- the targets shown in Grafana
- Grafana JSON Data Source
- the same username / password as above to access ArangoDB. This is a global configuration.
- per dashboard variables. This step is optional.
The following steps describe a simple configuration without any special targets and/or dashboard variables.
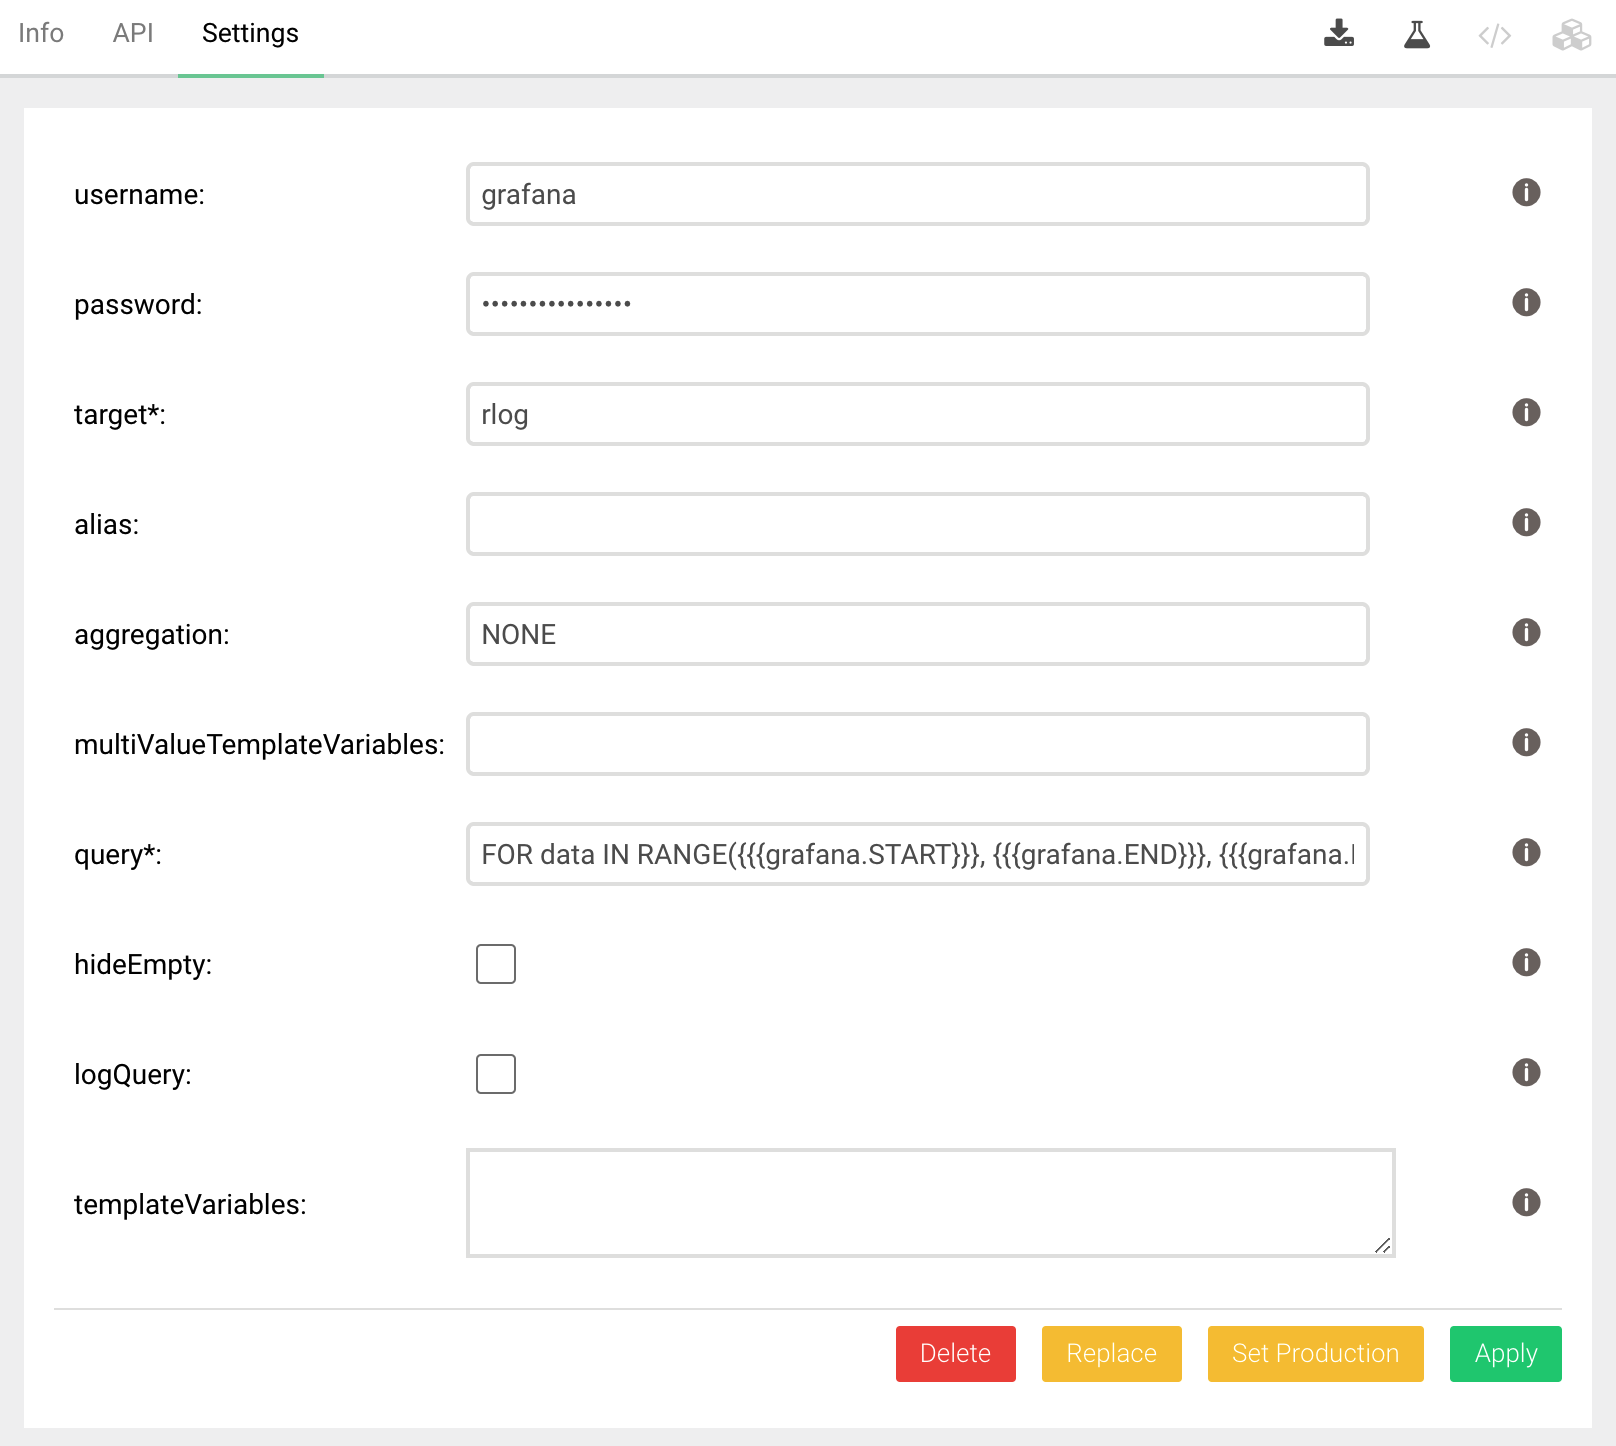
You should have installed the Foxx service as described above. The Settings tab will show the configuration page.
There are two possible configurations for authorization depending on the value of server.authentication-system-only.
If true then Foxx apps are not authenticated and need to provide their own authentication. In that case you should
define
- username
- password
If false then Foxx apps are using the normal authentication, and you should create a read-only user with access to the
database.
In either case you will need the username and password later when configuring the JSON data source in Grafana.
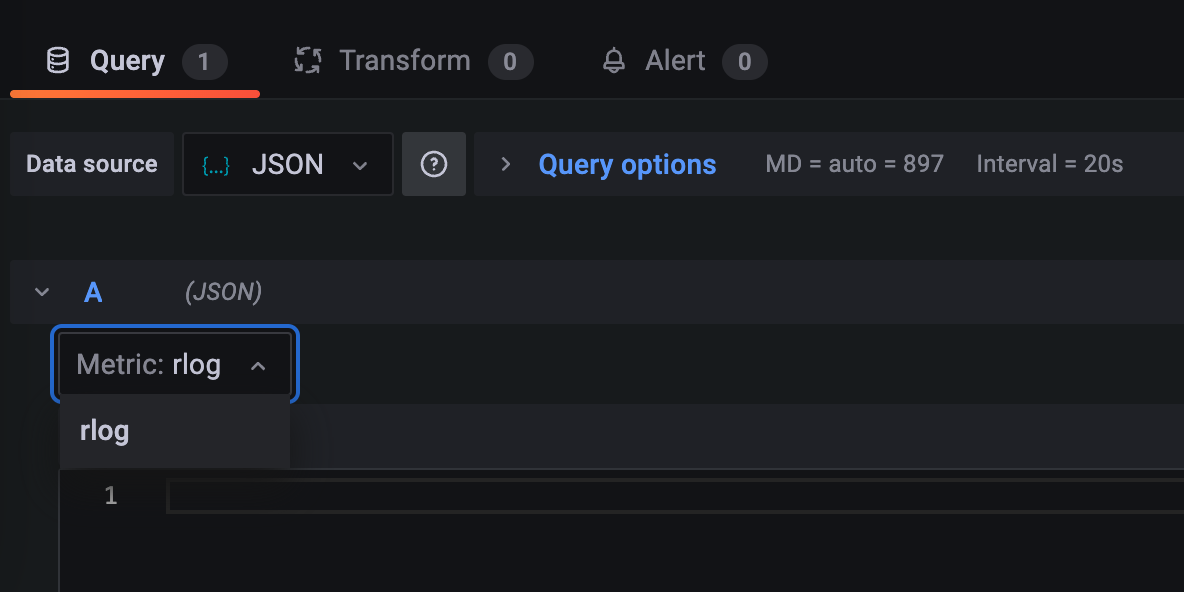
target can be any name. It will be shown in Grafana under the Metric selector when defining a query.
Leave alias and multiValueTemplateVariables, templateVariables empty for now.
Define the following dummy query
FOR data IN RANGE({{{grafana.START}}}, {{{grafana.END}}}, {{{grafana.INTERVAL}}})
    LET doc = {time: data, value: data}
See below for a detailed explanation. Save the configuration.
Assuming that the database is called rlog and the Foxx service is mounted at
rlog2 then you can check using curl
> curl "http://localhost:8529/_db/rlog/rlog2/" --user username:password
{
    "ok": true
}
To add the connector as a data source in Grafana, navigate to Configuration > Date Sources and press the Add data source button, then select the Json data source.
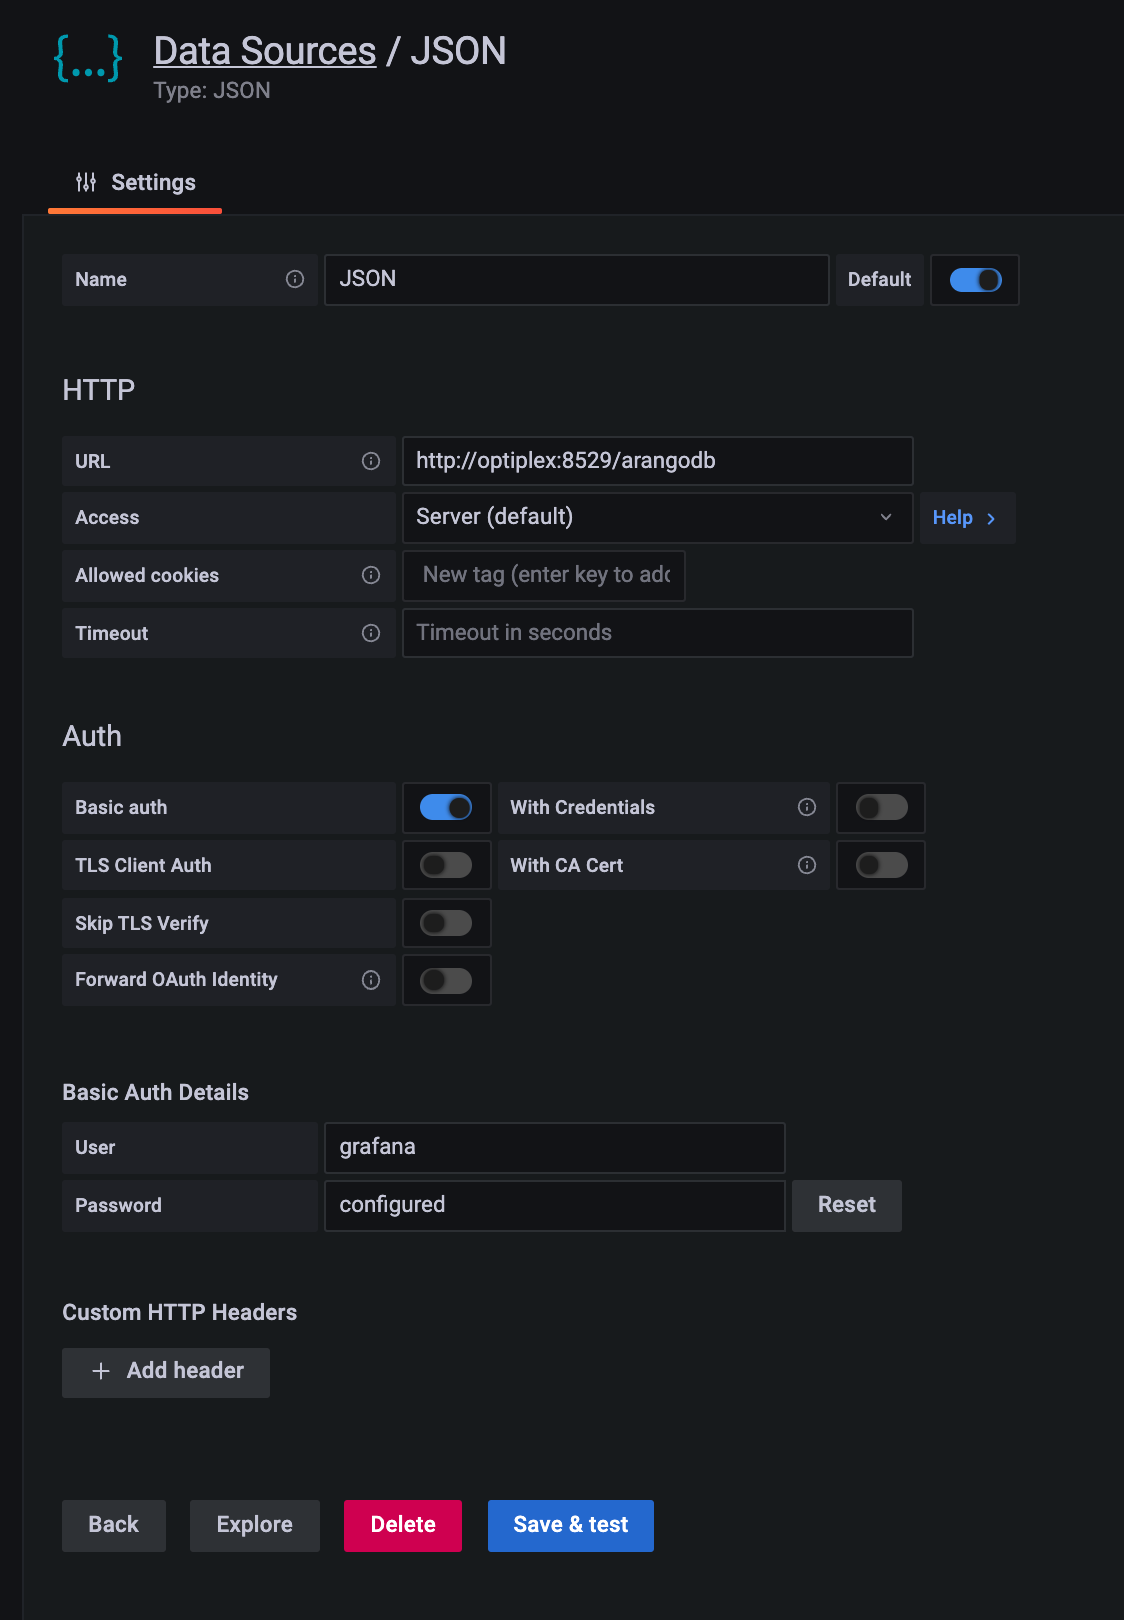
Enter the URL of the service, e.g. http://localhost:8529/_db/rlog/rlog2, and tick the checkbox for Basic Auth, then
enter the credentials you defined while configuring the service.
After pressing Save & Test you should see a Data source is working message. If you any other message, for
example Forbidding check the values you entered.
Now you can access ArangoDB from within Grafana.
Create a dashboard and add a panel using the datasource.
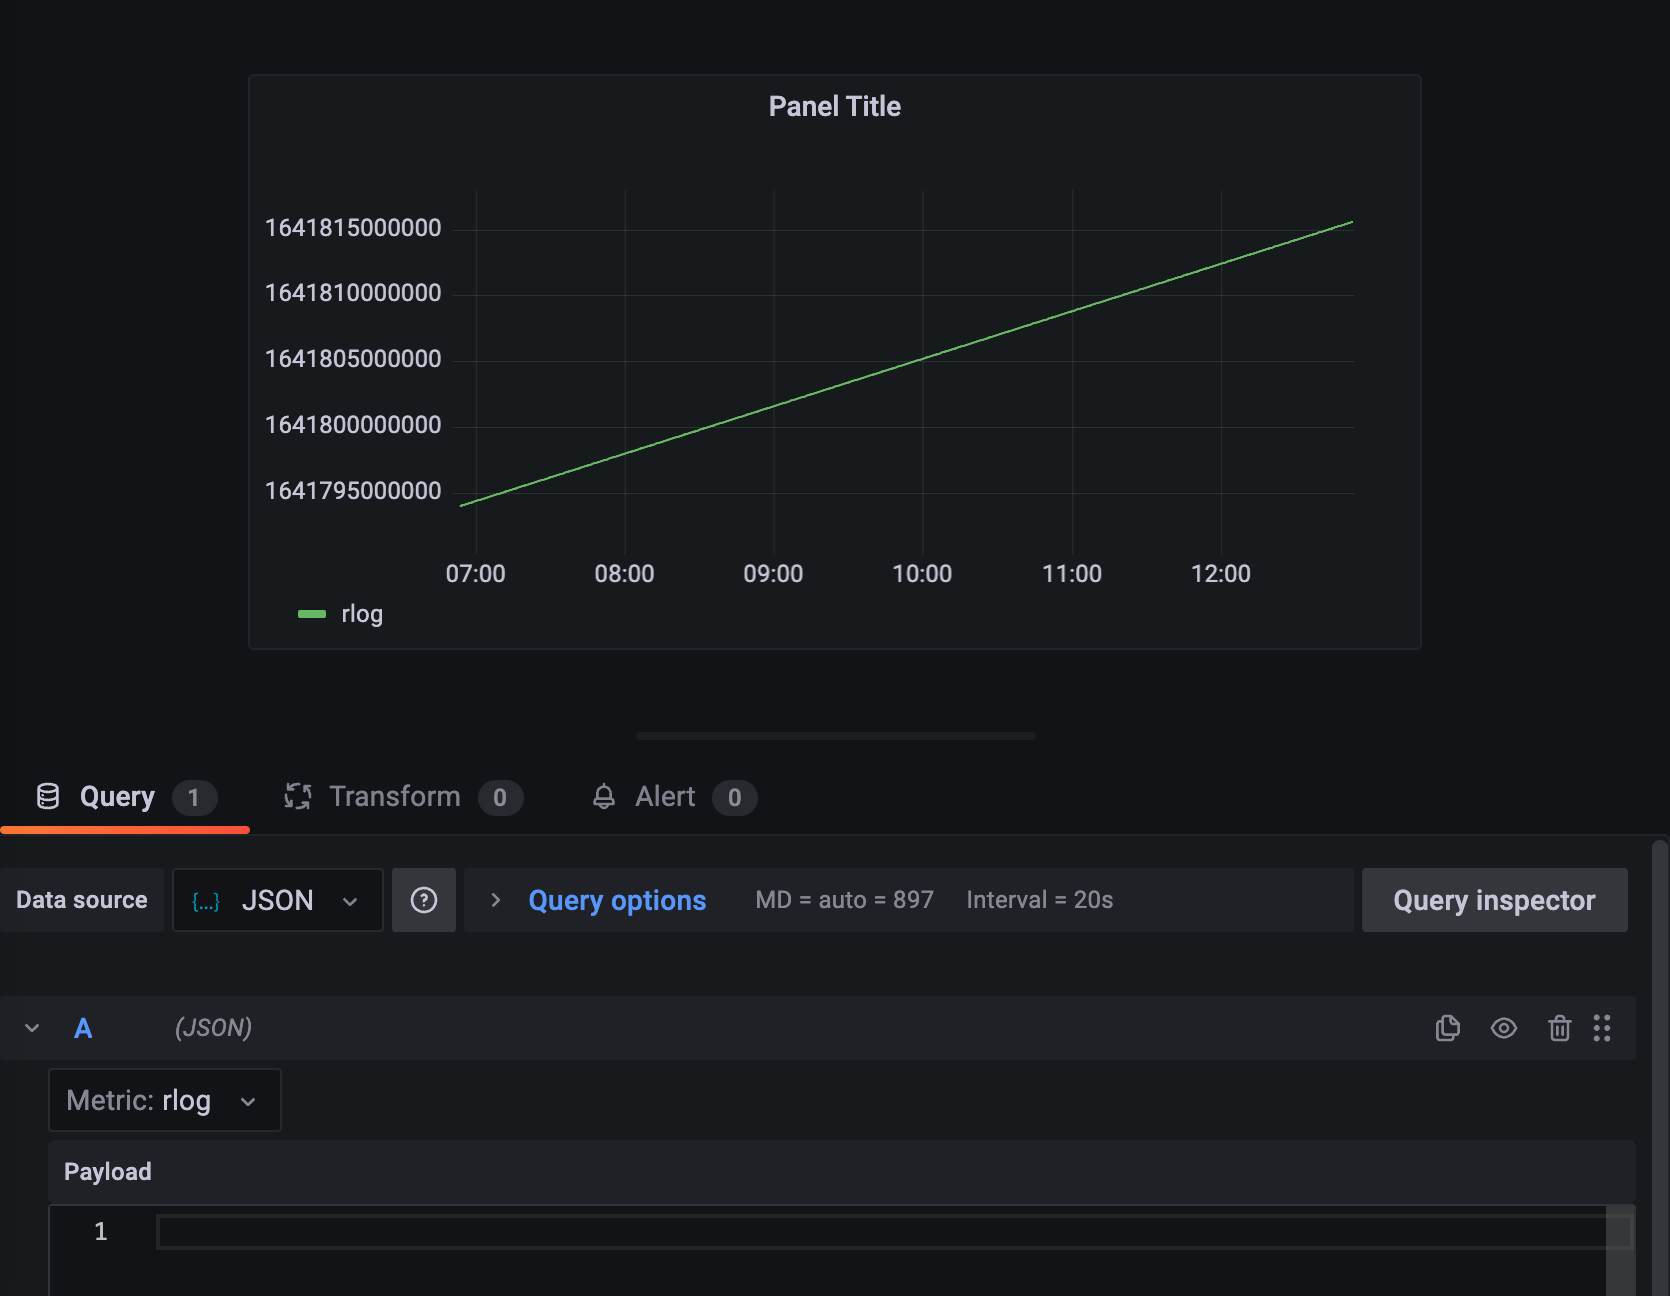
You will see a straight line for any time range.
The purpose of the Grafana connector is to allow time series data from ArangoDB to be displayed in Grafana. As ArangoDB is a multi-model database and not only a time series one, it requires you to provide a query that will produce a time series when executed. The current query is
FOR data IN RANGE({{{grafana.START}}}, {{{grafana.END}}}, {{{grafana.INTERVAL}}})
    LET doc = {time: data, value: data}
In general, the query defined should generate a sequence of documents called doc
that contain two attribute time and value. The attribute time is a timestamp expressed as milliseconds since
1.1.1970. The attribute value must be a number.
Note that the query is not a complete AQL query. In the following example a FILTER and RETURN are automatically added so
that the final query is
FOR data IN RANGE(1641643318607, 1641816118607, 120000)
    LET doc = {time: data, value: data}
    FILTER doc.time >= @value0 AND doc.time < @value1
    SORT doc.time
    RETURN [doc.value, doc.time]
The dummy query only contained static values. Now assume that you have a collection
data the contains documents of the following type
{
    "date": 1641643318607,
    "value": 0.7433146809895126
}
and you want to use this collection as data source. In this case the query looks like
FOR data IN data
    LET doc = {time: data.date, value: data.value}
This query will be augmented and executed as
 FOR data IN data LET doc = {time: data.date, value: data.value}
      FILTER doc.time >= @value0 AND doc.time < @value1
      SORT doc.time
      RETURN [doc.value, doc.time]
As you can see the query will return all data points within the time range. Sometimes you want to restrict the data returned and instead return an aggregation. For example, the average.
Go back to ArangoDB configuration and change the aggregation entry from NONE to
AVG. Now the final query will be
FOR data IN data LET doc = {time: data.date, value: data.value}
      FILTER doc.time >= @value0 AND doc.time < @value1
      COLLECT date = FLOOR(doc.time / @value2) * @value2
      AGGREGATE value = AVERAGE(doc.value)
      SORT date
      RETURN [value, date]
It is possible to allow the Grafana user to select an aggregation. Instead of just defining a single aggregate, you can
define multiple, comma-seperated values. For example, NONE,SUM,AVG.
However, in order to give the user a choice you need to change the target to
rlog.{{{aggregation}}}
Now the Metric drop-down will show
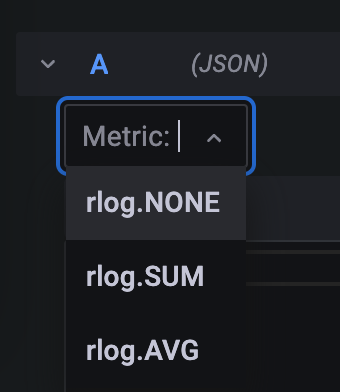
Why is that so? The Grafana connector will generate one target per aggregation defined. It also uses Mustache to allow
parameters within defined strings. In this example, the target is defined as rlog.{{{aggregation}}}. The part
{{{aggregation}}} will be replaced by the current value of the aggregation.
It is also possible to use different collections. Assume your data is stored in data and another time series
in rlog.
If you define the target as
data,rlog
and your query as
FOR data IN {{{target}}}
    LET doc = {time: data.date, value: data.value}
Combining these feature requires a bit more work because targets will be
data.{{{aggregation}}},rlog.{{{aggregation}}}
This can no longer be used as a collection name. You need to define an alias as well
data,rlog
and change the query to
FOR data IN {{{alias}}}
    LET doc = {time: data.date, value: data.value}
While the above approaches let you define the collection to use when setting the query in Grafana, there is also a different solution. Grafana allows for variables to be defined that the user can select in the dashboard.
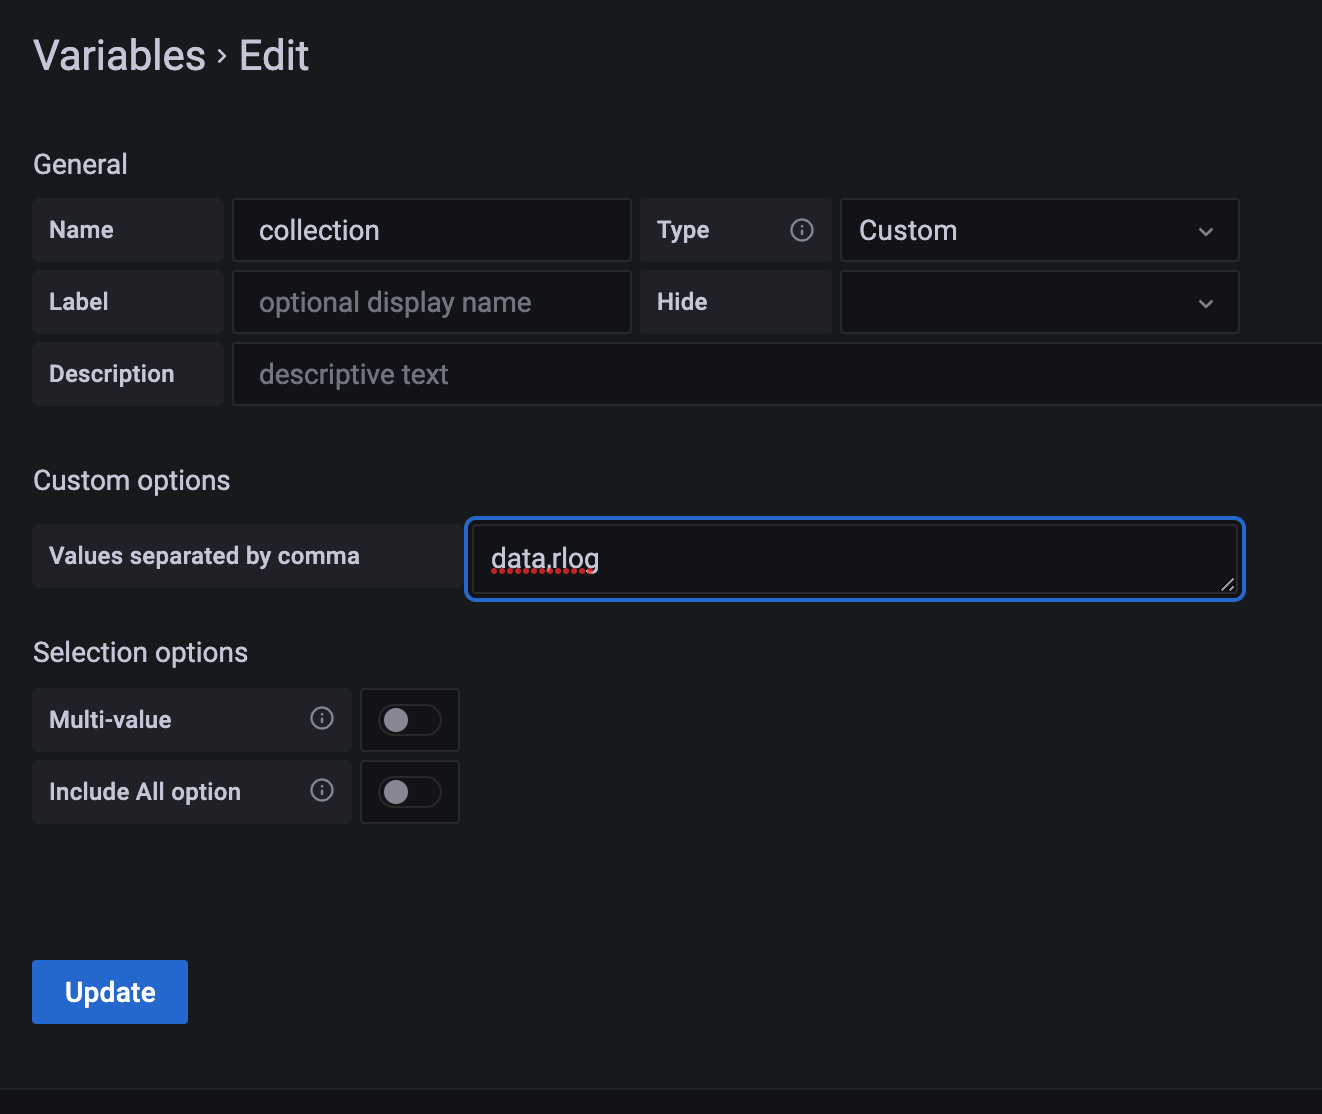
The Custom query allows you to specify a number of static values. These can then selected in the dashboard.
Change the target to
{{{aggregation}}}
clear the alias, and define the query
FOR data IN {{{grafana.collection}}}
    LET doc = {time: data.date, value: data.value}
Change the option for the variable defined above in Grafana to Multi-value. This will allow you to select one or more
options. However, if you select both
data and rlog you will see an error message. This is because you need to configure the variable in ArangoDB as well.
Go to Settings and set
multiValueTemplateVariables to
collection
With this definition the Grafana connector will iterate over all values selected and create a separate response.
Instead of hard-coding the different collection names you can also query the Grafana connector.
In the Grafana connector define
{"collections":"for c in ['data', 'rlog'] return c"}
This will define a template variable query called collections.
Go back to variable definitions in Grafana and change it to
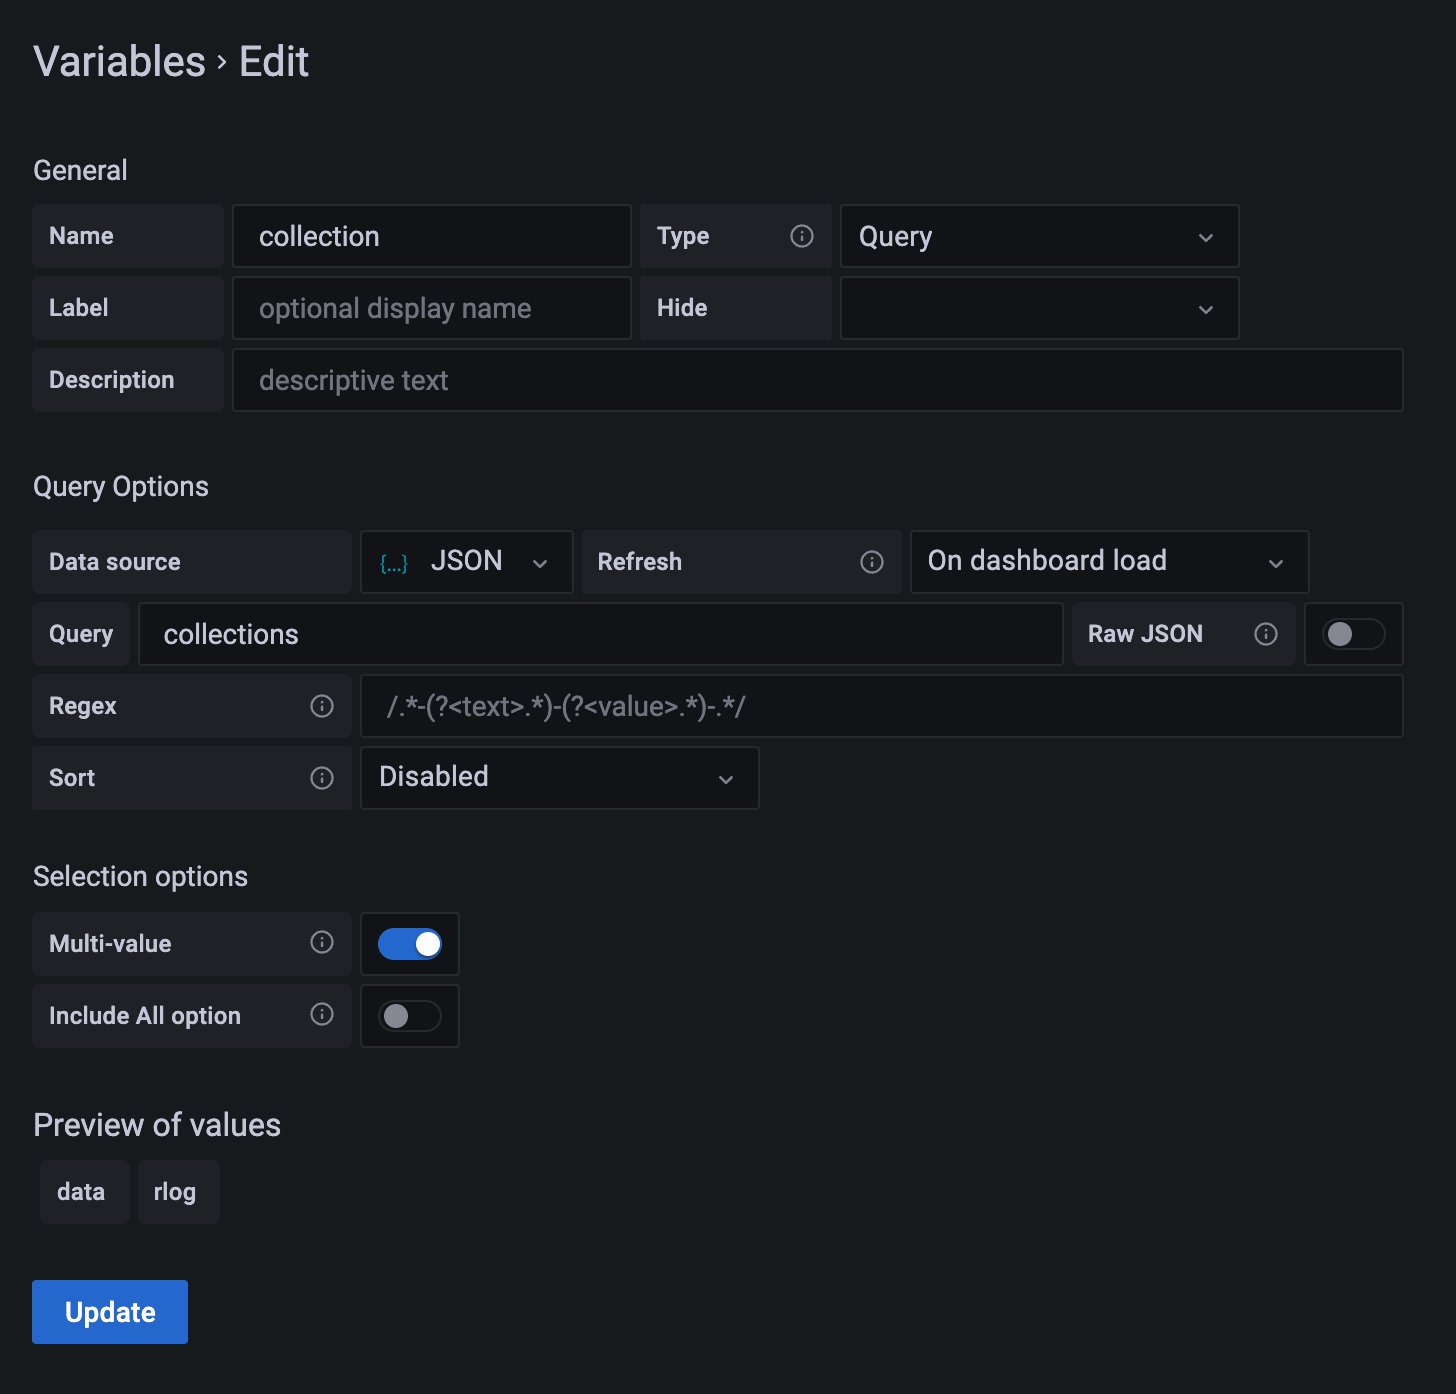
This will now use the query defined in the connector to extract the values.
This code is licensed under the Apache License, Version 2.0.