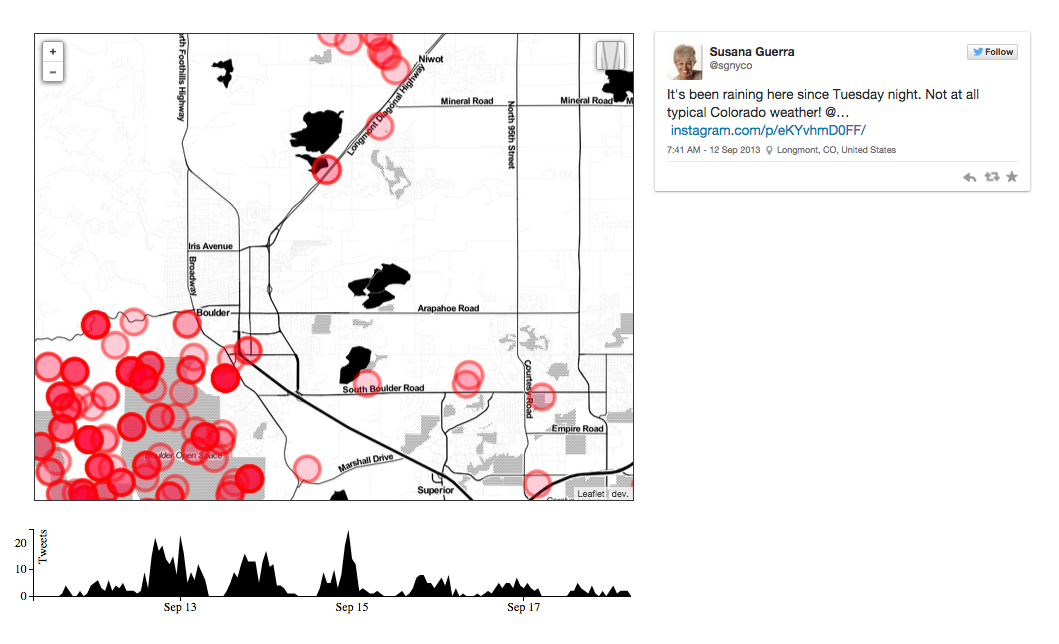
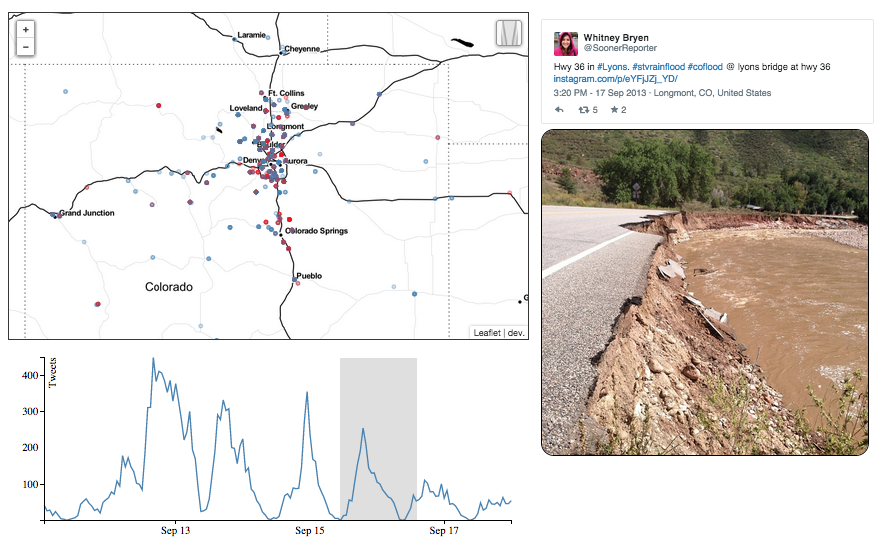
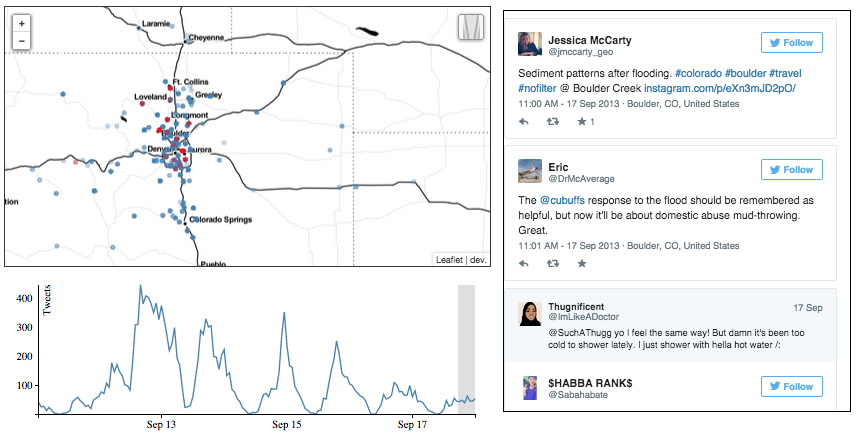
Replay twitter events to explore relevant geographic information as the conversation unfolds.
-
Talk about the final viz, collect data, talk about the final viz, format
data, talk about the final viz, add 3rd party data, reformat data, ... -
Decide on inital region for map:
West: -105.5270
North: 40.2342
East: -105.0233
South: 39.9088 -
Review resources.
-
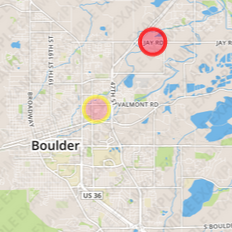
Create a map and add points using the tutorial on Leaflet.js
-
Learn how to embed tweets programatically.
-
Build a line graph for Tweet volume.
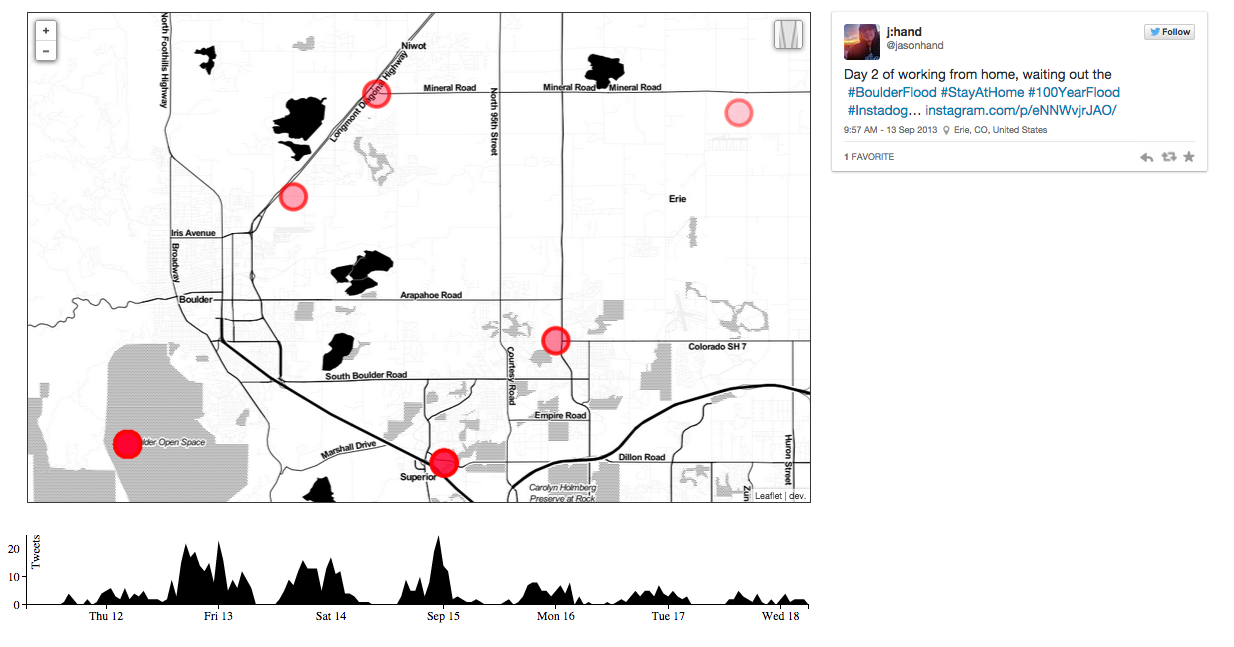
-
Learn jitter techniques and apply an appropriate solution.
- Learn how to dynamically update the map based on mouse's position in the timeline.
- [Line graph tooltip] (http://bl.ocks.org/d3noob/e5daff57a04c2639125e)
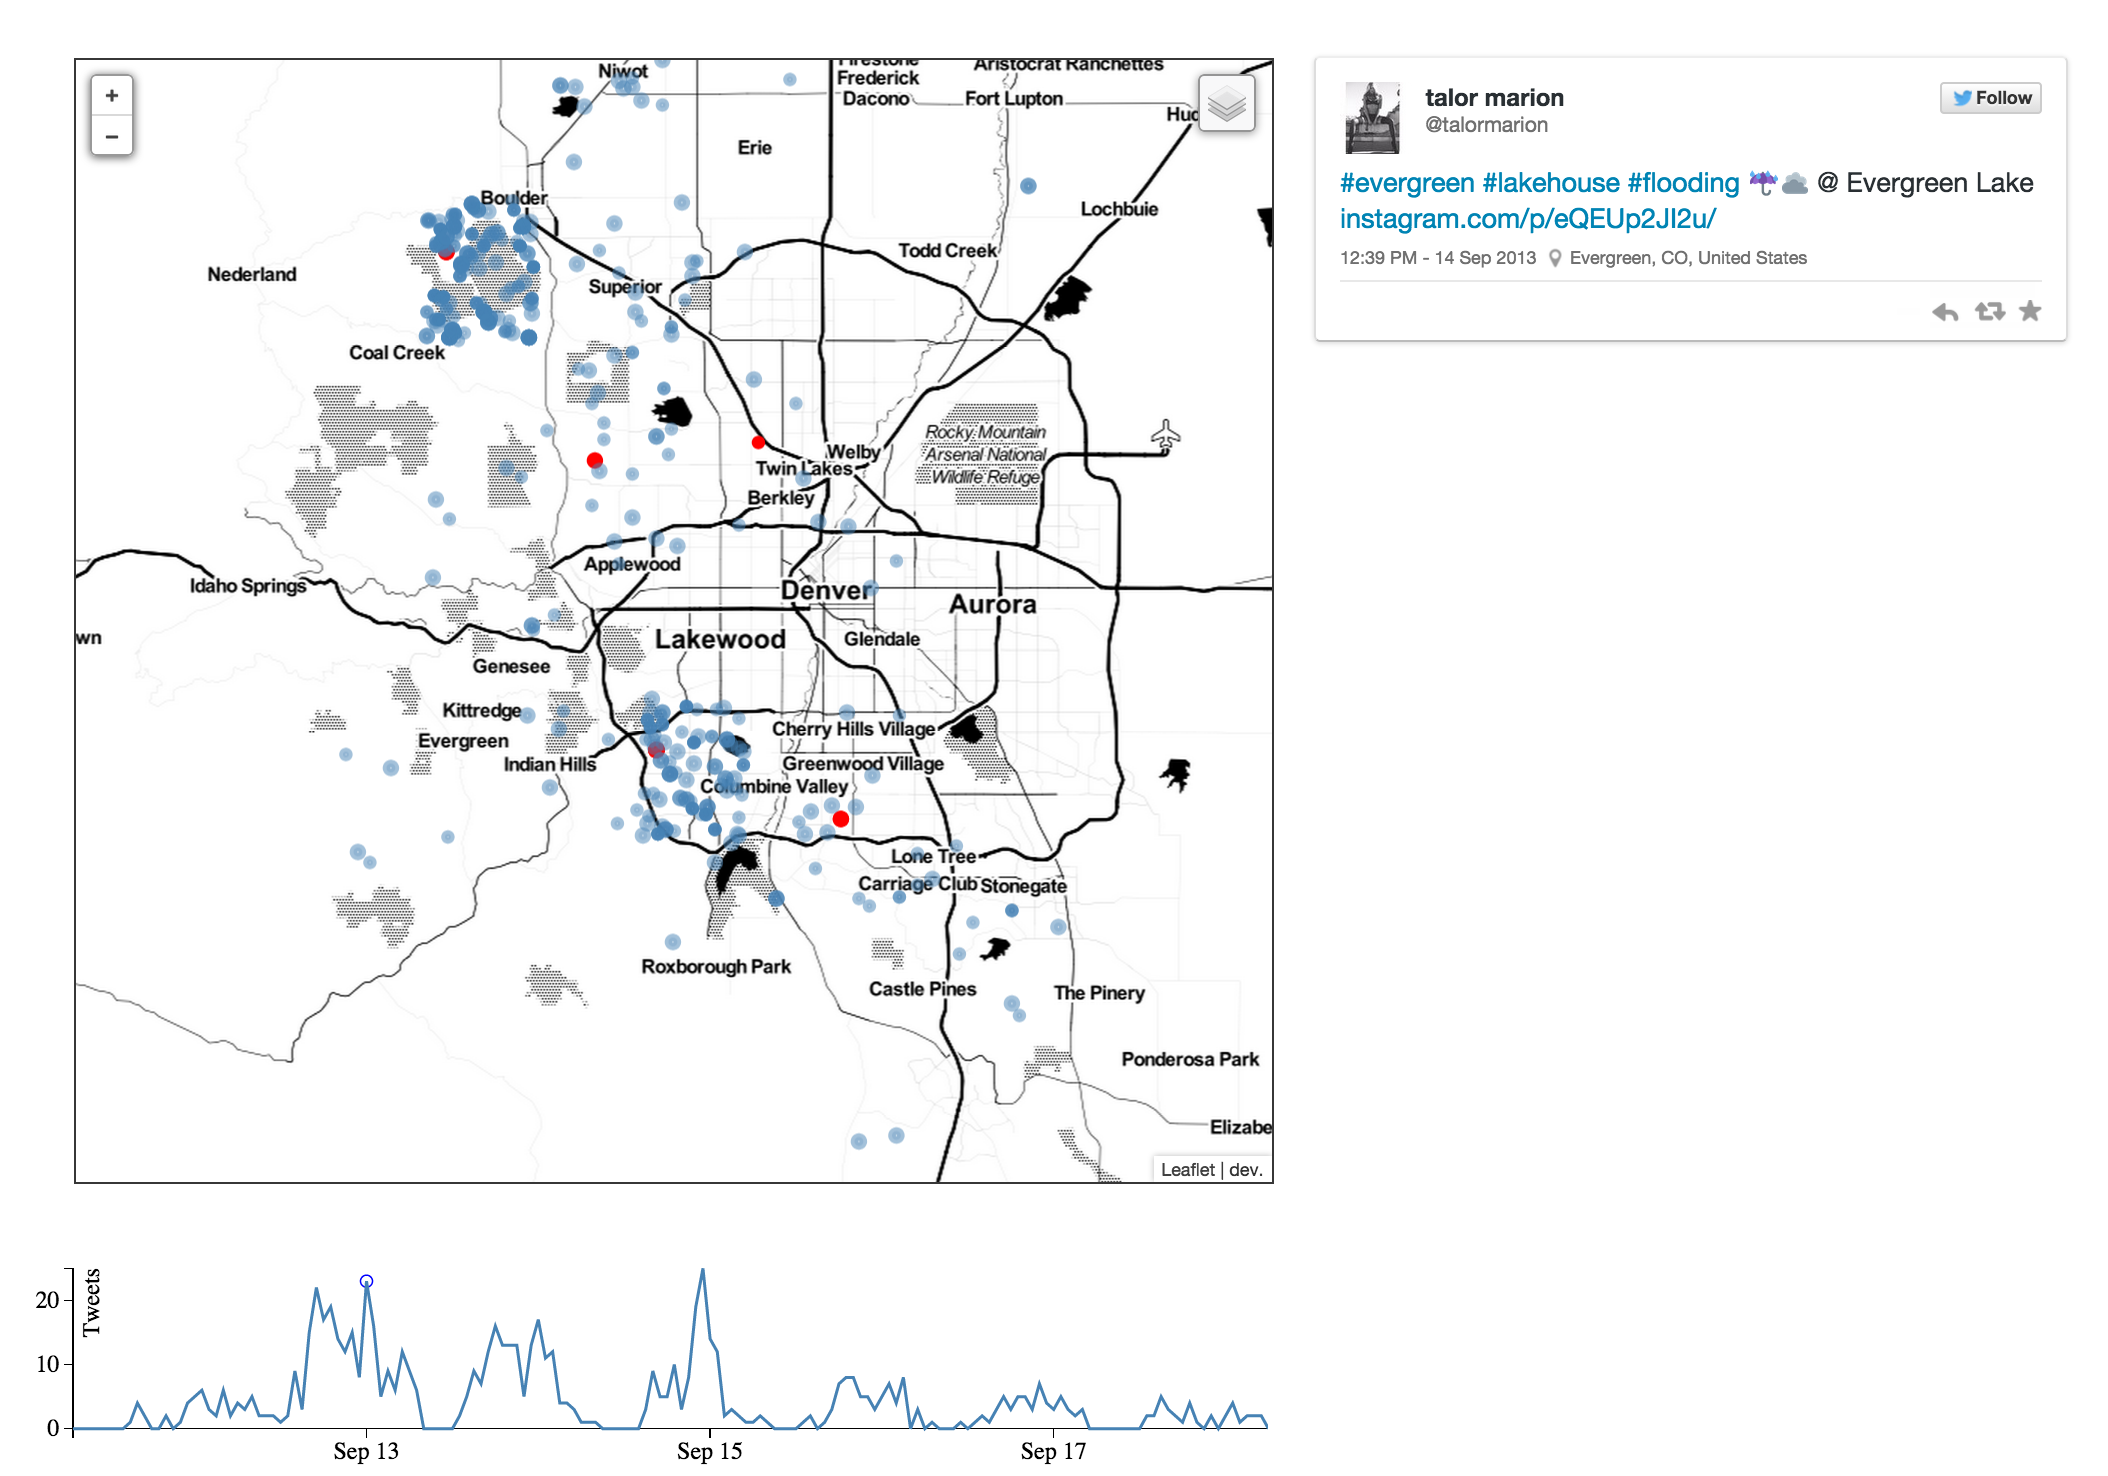
- Learn how to embed photos from instagram.
- Learn how to use a brush.
- Add scrolling for brush selections.
- Ideas for iteration:
- New statistics field (both global and interval level).
- Radio buttons for timeline stats.
- Bar graph for external data by date.
- New data format:
- TimeStamp
- stats (total_tweets, media_total, geo_total, optional_hashtag_count)
- tweets_geo: (geoJson w/ properties: tweet_url, media_native, media_external, geo_type)
- tweets_VIT: (set of tweet urls)
- TimeStamp
