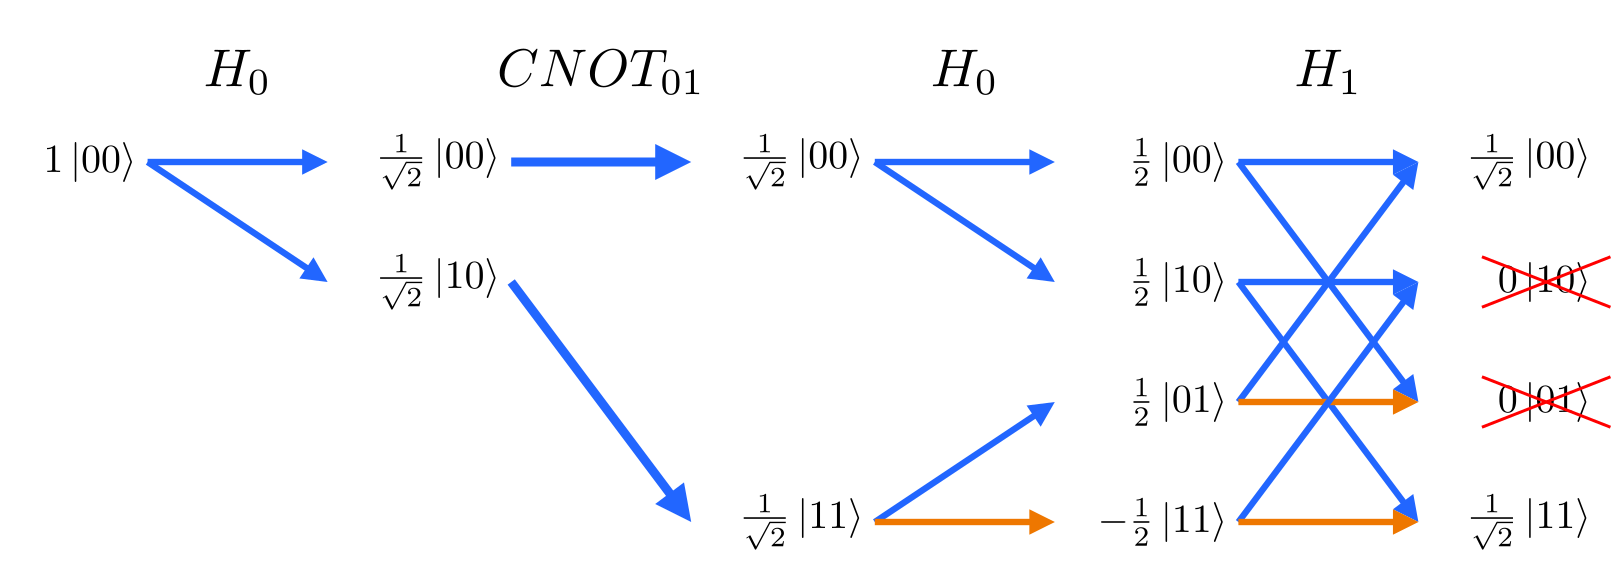
A visualization tool for the Feynman Path Sum applied to quantum circuits. The path integral formulation is an interpretation of quantum mechanics that can aid in understanding superposition and interference.
Path sum:
Circuit diagram:
How to read a path sum diagram:
- Time flows from left to right as gates are executed on qubits.
- Arrows transition from one state to another and traversing the arrows gives a path to an output.
- Two diverging arrows indicate a split into two potential outcomes.
- An orange arrow indicates a negative sign is added to that outcome.
- When two arrows converge, the amplitudes are summed.
- Quantum interference is when positive and negative amplitudes cancel in this sum.
- The rightmost column lists the possible measurement outcomes along with the final probability amplitudes of measuring each outcome.
See also: Bloch sphere visualization
feynman_path is available on PyPI:
python3 -m pip install feynman_pathSeveral non-python tools are used to generate the graphics and various output formats. These non-python dependencies are listed below and platform-specific installation instructions can be found here.
- LaTeX: A distribution of LaTeX that provides the
pdflatexcommand needs to be installed separately. Used to generate the gate and state labels. - pdf2svg: Used to convert the LaTeX expressions into SVG elements.
- Inkscape (optional): Only required to convert the output to PDF format.
- Cairo (optional): Only required to convert the output to PNG format.
sudo apt install texlive pdf2svg inkscape libcairo2 # Or texlive-latex-recommended, or texlive-latex-extraUsing homebrew:
brew install --cask mactex inkscape
brew install pdf2svg cairoThis package provides a command line tool to generate diagrams.
feynman_path interference 2 h0 cnot0,1 z1 h0 h1 cnot1,0 h1feynman_path interference 2 h0 cnot0,1 z1 h0 h1 cnot1,0 h1 --circuit$ feynman_path -h
usage: feynman_path [-h] [--svg] [--png] [--pdf] [--sequence] [--circuit]
[--scale SCALE] [--verbose]
name n_qubits gate [gate ...]
Renders a Feynman path sum diagram for a sequence of quantum gates.
positional arguments:
name The file name to save (excluding file extension)
n_qubits The number of qubits in the quantum circuit
gate List of gates to apply (e.g. h0 z1 cnot0,1)
optional arguments:
-h, --help show this help message and exit
--svg Save diagram as an SVG image (default)
--png Save diagram as a PNG image
--pdf Save diagram as a PDF document
--sequence Save a sequence of images that build up the diagram from left
to right as <name>-nn.svg/png/pdf
--circuit Save a standard quantum circuit diagram named
<name>-circuit.svg/png/pdf instead of a Feynman path diagram
--scale SCALE Scales the resolution of the diagram when saved as a PNG
--verbose Print extra progress information
feynman_path also provides a Python 3 package as an alternative to the command line tool. Diagrams can be viewed directly in a Jupyter notebook or saved.
import feynman_path

n_qubits = 3
font = 12
ws_label = 4+0.55*n_qubits  # Label width relative to font size
w_time = 60+ws_label*font  # Diagram column width
f = feynman_path.Diagram(
    n_qubits, font=font, ws_label=ws_label, w_time=w_time)

f.perform_h(0)
f.perform_cnot(0, 1)
f.perform_z(1)
f.perform_cnot(1, 2, pre_latex=r'\color{red!80!black}')
f.perform_h(0)
f.perform_h(1)
f.perform_cnot(1, 0)

f.draw() # Display in Jupyterf.draw().save_svg('output.svg') # Save SVG
f.draw().set_pixel_scale(2).save_png('output.png') # Save PNG
import latextools
latextools.svg_to_pdf(f.draw()).save('output.pdf') # Save PDFSee examples/render_examples.py for more example code.
The CNOT gate (⋅–⨁) can be used to entangle two qubits, creating a Bell pair, but for certain input qubit states, the CNOT will have no effect.
Create a Bell pair by using a CNOT on the |+0⟩ state (q0=|+⟩, q1=|0⟩):
Note the output (rightmost) column is an entangled state: |00⟩+|11⟩
feynman_path no-entanglement 2 h0 cnot0,1 h0 h1Fail to create a bell pair by using a CNOT on the |++⟩ state (q0=|+⟩, q1=|+⟩):
feynman_path no-entanglement 2 h0 h1 cnot0,1 h0 h1Note the output (rightmost) column is a separable state: |00⟩
In classical computing, it is common to inspect intermediate steps of a computation. This can be very useful for debugging. In quantum computing however, this destroys the effect of interference. We can use a CNOT gate (⋅–⨁) to copy an intermediate value onto another qubit to inspect later. Shown below, copying the intermediate value of q1 to q2 changes the output of q0, q1.
Original circuit that compute the output q0=1, q1=0:
feynman_path interference 2 h0 cnot0,1 z1 h0 h1 cnot1,0 h1The addition of CNOT1,2 to inspect the intermediate value of q1 changes the output of q0:
Note how the path diagram is the same except the arrows at H1 are now split into the upper and lower halves of the diagram and don't interfere anymore.
feynman_path no-interference 3 h0 cnot0,1 z1 cnot1,2 h0 h1 cnot1,0 h1


