-
Notifications
You must be signed in to change notification settings - Fork 1.8k
New issue
Have a question about this project? Sign up for a free GitHub account to open an issue and contact its maintainers and the community.
By clicking “Sign up for GitHub”, you agree to our terms of service and privacy statement. We’ll occasionally send you account related emails.
Already on GitHub? Sign in to your account
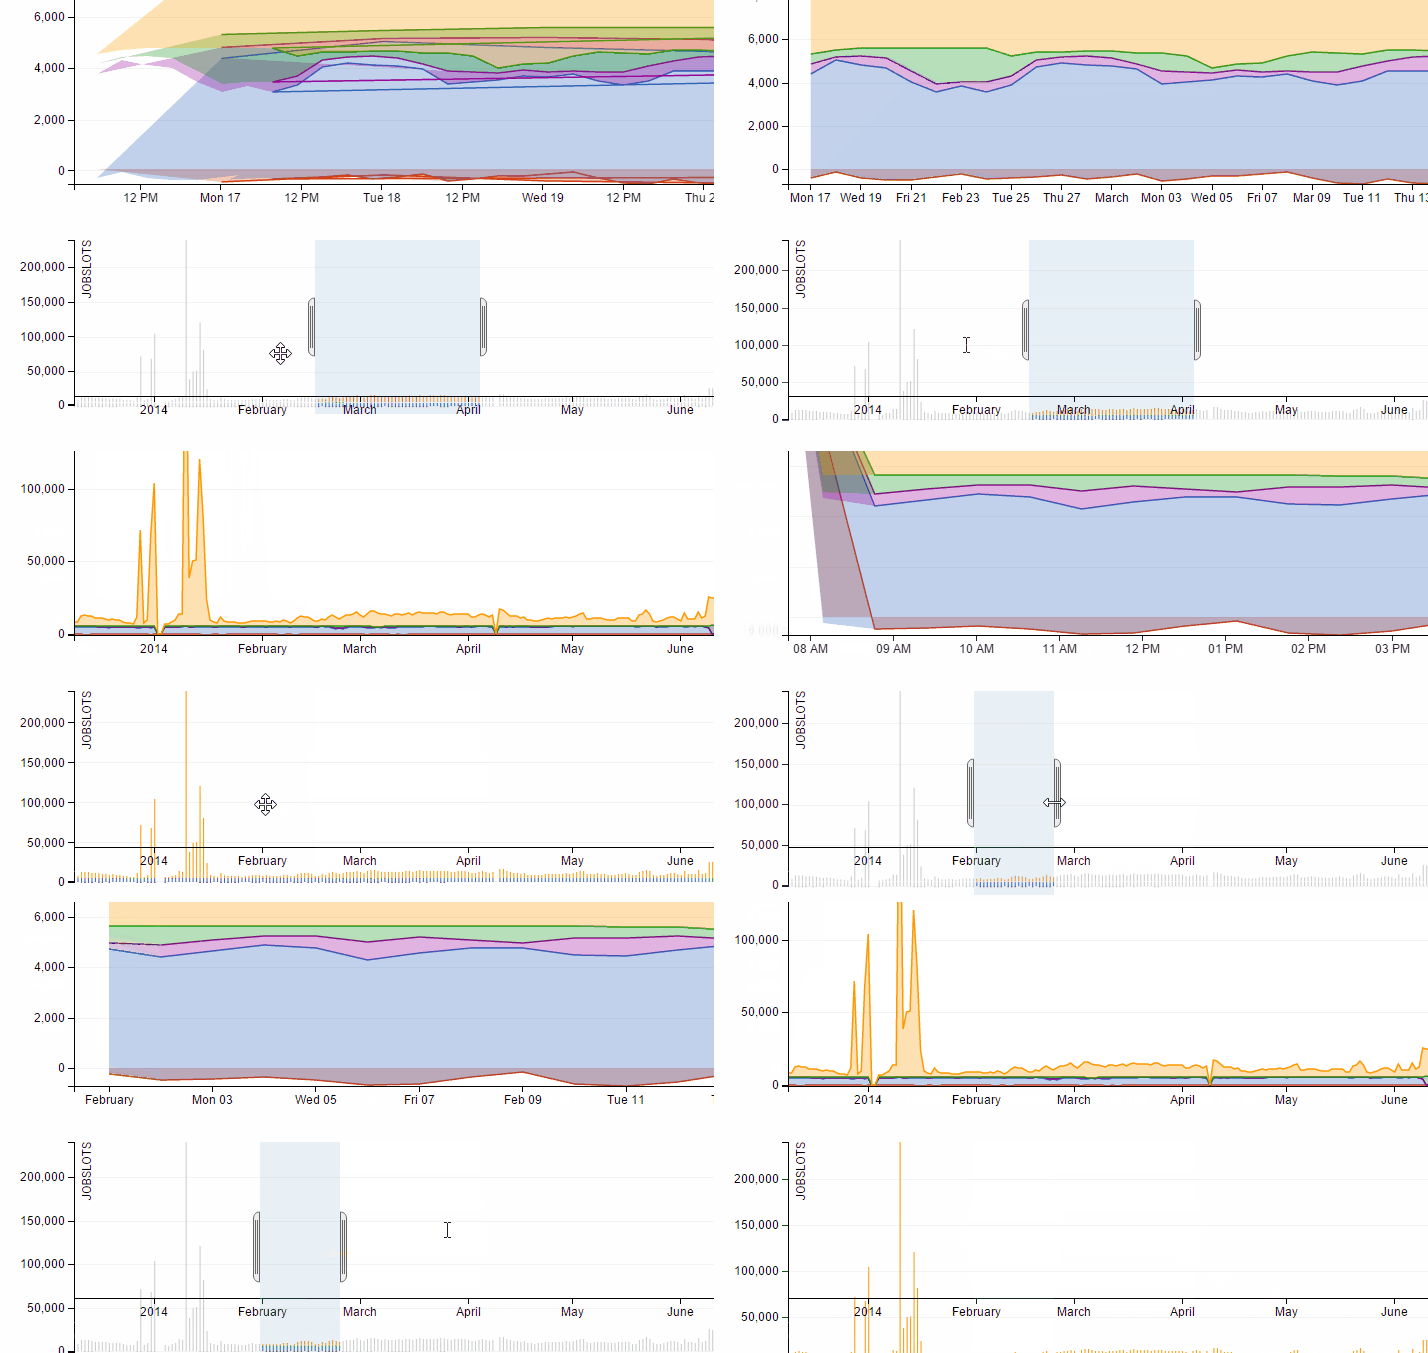
chart height changes by using the brush #980
Comments
|
It has to be an interaction with the resize logic in your own code, since dc does not resize divs. Nonetheless, we will figure it out. Typically the axis will land in the wrong place if it's on a transition and then another modification comes along. Do you already have code which is trying to do the same thing as the fixes in beta 15, move the axis to fit the div? |
|
I only change the divs which contain the chart svgs. If I need to resize the charts I use the |
|
Ah, it seems that the problem lies in the fact that the root seems to always be 5 larger than the in my case. And _chart.height resizes based on the root node size, if no value is given. However, this is also the case for another chart, where this does not happen. On the one where it happens I did not explicitly set the chart height. So just setting the chart height fixed it for me.
|
|
Thanks @mueslo. So, are you setting |
|
Before I didn't set any chart height for the affected chart, now I'm just setting a fixed value. If no value is given, it just sets itself to the height of the element it is anchored to, see Lines 130 to 135 in cd61554
|
|
Ah, thank you @mueslo for reminding me of that other piece of responsive behavior. Yes, currently if you are not setting the width and height, then they have to be consistent with the width and height of the anchor/container element. Which makes me wonder how useful the automatic width/height are, since there is almost always a filter display or a title within the anchor div, taking part of the space. Perhaps these margins or adjustments have to be added to the calculation. |
|
@Phisherman, does this also explain the behavior you're seeing? |
|
@gordonwoodhull: I now changed to But if I set a fixed height for the div container which embeds the bar chart it works (setting Why does this behaviour only apply to bar charts? With line charts there isn't this problem. I liked the behaviour of beta14 way more. The chart's height should be set with dc.js. |
|
Thanks @Phisherman. It's an important clue that the problem occurs when the containing div in your app does not have a fixed height. Is it using a percentage? It is very strange that If you are able to create a fiddle, or share a link with me (publicly or by email), we can track this down better. |
|
@gordonwoodhull Nope. I used a fixed px definition. At the moment I can't create a fiddle, sorry. |
|
I'm not sure what to do about this, since
|
|
Not sure that I agree @gordonwoodhull on your point 1. In order to have better control over layout and where controls go I tend to have a structure like bootstrap panel. In this case the actual container of the graph might not have the correct size. As you state in 3 it also changes with availability of content. |
|
Thanks @MatthiasJobst, this is a good data point. Maybe I should have said setting the size on render is "sometimes useful". It definitely works for some people, but it breaks down in very simple cases like the fiddle you demonstrated. The reason that the content changes size while the axes don't, is that you currently need to call chart
.width(...)
.height(...)
.rescale();But the size is applied regardless whether or not you call this, so they get out of sync. Two things which are not great - we are here due to retrofitting resize behavior onto a library that didn't originally support it. As noted above, somewhere the interface has to be broken - something we can consider for v2.1. It might be as simple as always applying the |
|
@gordonwoodhull, thanks for the detailed explanation of the problem. For the use cases that I have experience with rescaling was no issue. From that point of view deprecating Is there a difference between Regarding the size question I think that |
|
@MatthiasJobst, I agree that the chart shouldn't be dynamically sizing itself - I don't think that was ever intended. What's going on here is that one way or another the I also found at least one other related bug that already existed before we started sizing the SVG on redraw: #1070 I agree the solution is to only auto-calculate the size once. |
|
Correction: we should auto-calculate the size on each render, even if this can cause the height change problems described here, because it is expected that everything gets recalculated on render. And this was the behavior before beta 15. However, we should only calculate once, to avert the glitches described in #1070. Fixed in 2.0 beta 24. |


See here:

This problem occurs in beta15, beta16 and beta17. beta 14 works fine for me.
It's also only on the stacked bar charts. The line chart doesn't have this problem.
The text was updated successfully, but these errors were encountered: