-
Notifications
You must be signed in to change notification settings - Fork 42
PieCharts
Philip Wenig edited this page Aug 27, 2020
·
6 revisions

Pie charts are often used to display percentage data.
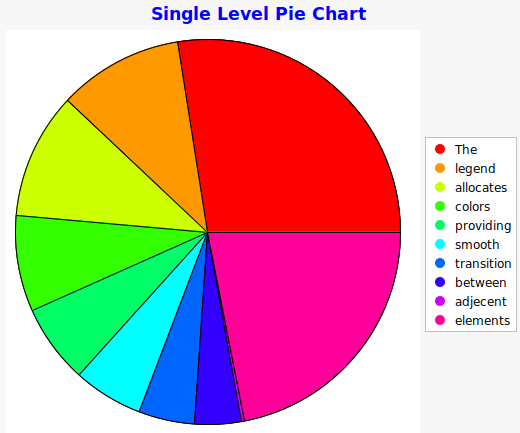
- Pie Chart
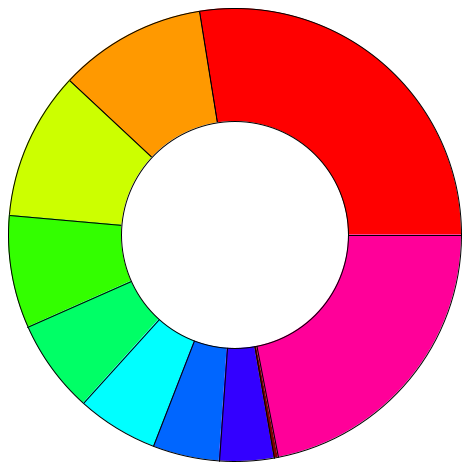
- Doughnut Chart
- Multilevel Pie Chart
- Multilevel Doughnut Chart
	public Chart createChart(Composite parent) {

		double[] values = {337309, 131646, 128948, 100123, 81708, 70478, 58226, 47806, 4067, 265783};
		String[] labels = {"USA", "Spain", "Italy", "Germany", "China", "France", "Iran", "UK", "India", "Other"};

		Chart chart = new Chart(parent, SWT.NONE);
		chart.getTitle().setText("Doughnut Chart");
		ICircularSeries<?> circularSeries = (ICircularSeries<?>)chart.getSeriesSet().createSeries(SeriesType.DOUGHNUT, "pie series");
		circularSeries.setSeries(labels, values);
		Color color = Display.getDefault().getSystemColor(SWT.COLOR_DARK_RED);
		circularSeries.setColor("India", color);
		//
		return chart;
}org.eclipse.swtchart
Pie Charts and Doughnut Charts in the SWTChart bundle support building single level and MultiLevel Charts.
    Chart chart = new Chart(parent, SWT.NONE);
chart.getTitle().setText("Title"); ICircularSeries<?> circularSeries = (ICircularSeries<?>)chart.getSeriesSet().createSeries(SeriesType.PIE, "series title here"); ICircularSeries<?> circularSeries = (ICircularSeries<?>)chart.getSeriesSet().createSeries(SeriesType.DOUGHNUT, "series title here"); circularSeries.setSeries(String[] labels, double[] values);Error is thrown if labels.length != values.length


circularSeries.getNodeById("Element Label").addChildren(String[] childrenLabels, double childrenValues);

circularSeries.setColor("Label of Node", Color color); multiLevelPie.setHighlightedNode(multiLevelPie.getNodeById("Label"));Set the highlight settings
    circularSeries.setHighlightLineWidth(int width);
circularSeries.setHighlightColor(Color color); circularSeries.setBorderStyle(int borderStyle);
circularSeries.setBorderWidth(int borderWidth);
circularSeries.setBorderColor(Color color); circularSeries.setDataModel(IdNodeDataModel data);
circularSeries.getModel(); circularSeries.getPieSliceFromPosition(int x, int y);org.eclipse.swtchart.extensions
For both Pie Chart and Doughnut Chart,
PieChart circularChart = new PieChart(Composite parent, int style); ICircularSeriesData circularSeriesData = new CircularSeriesData();
circularSeriesData.setSeries(String[] labels, double[] values);
circularSeriesData.getNodeById("Element Label").addChildren(String[] childrenLabels, double childrenValues);Set the settings, before applying the data to the chart
circularChart.addSeriesData(circularSeriesData); ICircularSettings circularSettings = circularSeriesData.getSettings(); circularSettings.setSeriesType(SeriesType type); circularSettings.setRedrawOnClick(boolean setRedrawOnClick);
// set true to render chart dynamically. If false, will highlight the node on click.


    circularSettings.setFillEntireSpace(boolean fillEntireSpace);
//set true to enable IChartSettings chartSettings = getChartSettings();Displays data of the node on hover.
chartSettings.setShowLegendMarker(boolean showLegendMarker);
ParallelPieCharts(Composite parent, SeriesType type, boolean redraw);- SeriesType is SeriesType.PIE for Pie Charts, SeriesType.Doughnut for Doughnut Charts
- The third Parameter is true if dynamically the charts need to be redrawn, else they will be highlighted in sync.


Each chart is drawn separately, but are in sync with each other. The APIs cover all the functionalities that individual Pie Charts can offer.
addPieChartSeries(String labels[], double val[][]);- The first argument denotes the label of each pie slice of a chart.
- The size of the second argument is same as that of the first, and each of the element is the list of values the label string in the corresponding first argument will take in the charts. (Same as in Linux Pie Chart Tools)


addChild(String parentId, String childId, double[] vals);- The first argument is the label of the Pie Slice to which we are adding the Child
- The second argument is the label of the node we wish to introduce into the charts
- The third argument is the list of values that the node takes in all the charts.


setChartTitles(String[] titles);- Sets the titles of the charts
Copyright (C) 2008-2020 Eclipse SWTChart project. Eclipse Public License 2.0 (https://www.eclipse.org/legal/epl-2.0)