-
Notifications
You must be signed in to change notification settings - Fork 897
Debugging with Xcode
Chinese version of 使用 Xcode 调试 wgpu 程序
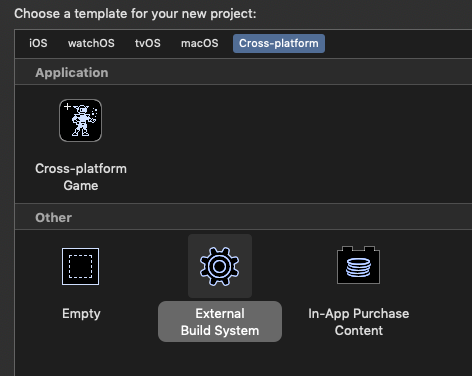
First we'll start by opening Xcode and creating a new project using the menu or "Create a new Xcode project" in the startup dialog.

Select "External Build System" as the project type.

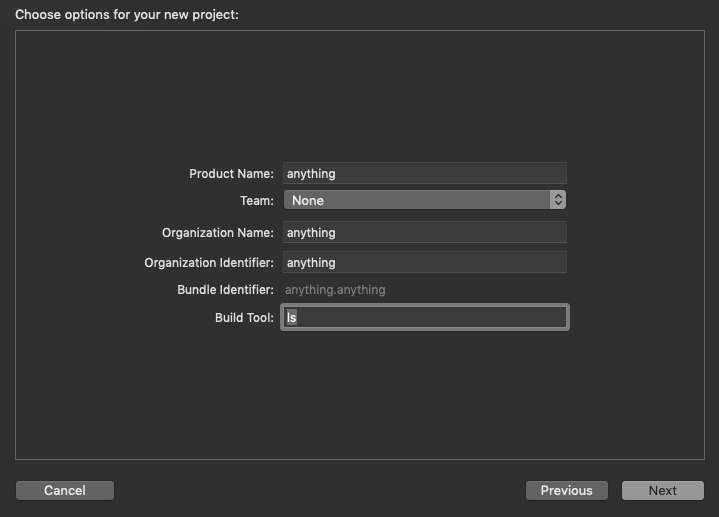
Choose which build tool to use in the "Build Tool" field. This will be called whenever we build in Xcode.
We can write our cargo build command here if we'd like Xcode to run it, but we could also skip the build step to avoid Xcode building the project for us.
It's possible to skip the build step by specifying our build command as ls, echo, or anything else that exits successfully (note: : doesn't appear to work here).
The rest of the fields don't actually matter to us, so we can put any values there.

Click on the project name and then click "Edit Scheme".

Under the "Options" tab we can choose the level of validation for Metal and whether to enable GPU frame capture.

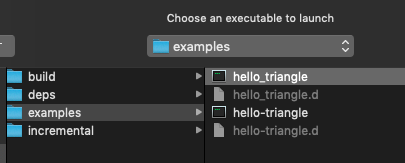
Under the "Arguments" tab we'll choose which executable to run. We want this to be the binary created by cargo. We'll select "Other" and then find the binary in the target directory.


Next we'll click the play button to run our binary and attach Xcode to it.

Now we should see our application running and some output telling us that Metal validation has been enabled.

To start a GPU capture, click the camera button while Xcode is attached to our running application.

After a frame has been captured, we will be able to use all the regular Metal tools (e.g. shader debugging, GPU statistics, etc.).