Releases: iteratec/OpenSpeedMonitor
v5.3.3
Improvements
- Technical refactoring of the loading spinner in Angular frontend to support multiple instances.
- The start values for the result selection are now set in the same way for all components.
Bugs
- We've fixed two errors (#289 and #290) which occured when trying to display page comparison chart and CSI benchmark chart (fixed with #293 and #292). Thanks @carloscohen2202 for opening the issues.
- Measurands where not set from the store which did result in some unexpected behaviour. Also, the locations were not reset when hitting the reset button.
- Query builder did not produce results for percentile data in some cases.
- The labels in the aggregation chart where displayed wrong on initial loading when comparison timeframe was selected.
- Some styling and usability improvements on the aggregation chart
v5.3.2
v5.3.1
Feature
Added the performance metric "First Paint"
Bugfix
Fixed a bug where a wrong result selection was possible
v5.3.0
Features
- We rebuild the aggregation chart as a new Angular component. The functionality is the same as before but it should be faster. The old implementation is still present as reference and the chart is available under the url
/aggregationLegacy/show. - When jumping to WebPagetests filmstrip view from the time series chart, the new sticky feature of this view is enabled by default.
Bugfixes
- We've fixed some minor issues we encountered whilst using the new metric finder.
- Exporting CSV data started to get very slow, so we fixed it.
- Interactive metrics are still a work in progress on many projects. Our mapping of interactive metrics from the WebPagetest result XML had to be adjusted.
- We removed the browser selection tab on the detail analysis dashboard, because it is currently not possible to filter by browser in this dashboard anyways.
v5.2.5
v5.2.4
v5.2.1
v5.2.0
Features
-
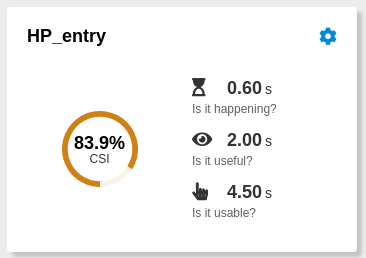
With Performance Aspects we introduced a new layer of abstraction on top of concrete performance metrics. We chose three of the "moments in user perception" Philip Walton described in his brilliant article about user-centric performance metrics as pre-defined performance aspects: Is it happening?, Is it useful? and Is it usable?.
-
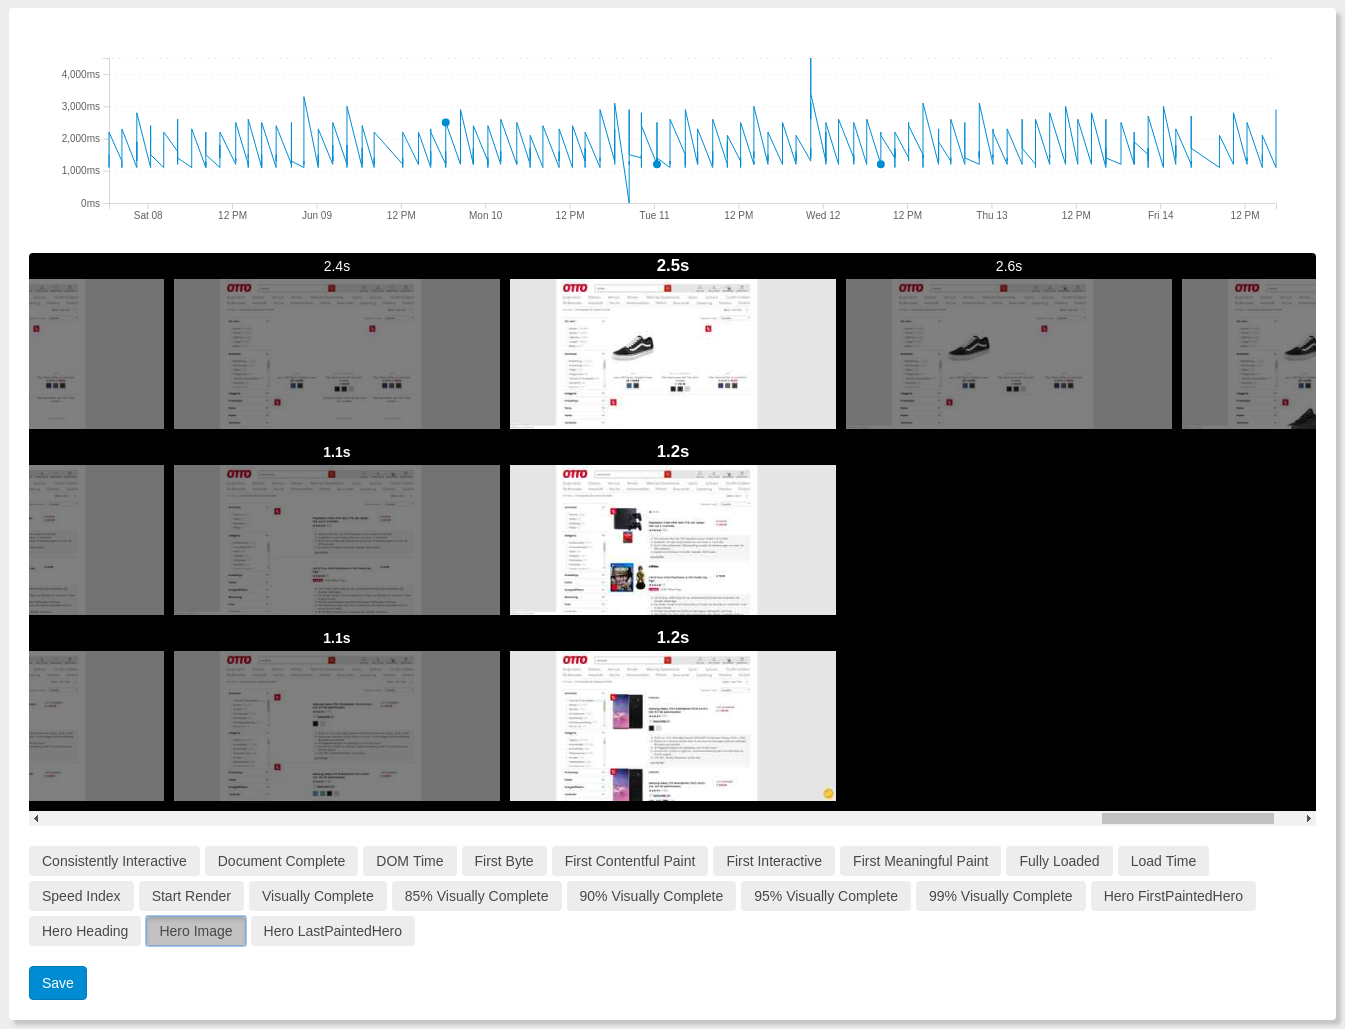
A new OpenSpeedMonitor view may be used to choose concrete metrics that represent the aspects for each browser and/or device. This view provides the possibility to choose metrics by a visual comparison of WebPagetest timeframes.
-
The average measured times for these aspects are shown for each page on application dashboard.
-
We combined dashboards for Page and JobGroup aggregation into one single Aggregation board. From now on this dashboard provides all the different possibilities for aggregation.
-
Until now a measured step was marked successful when either doc complete or fully loaded time exist. Now just one of the following metrics must have a value:
- ttfb
- start-render
- visually complete 100 %
- Speed Index
- Doc Complete
- Fully Loaded
-
Applications shown on homepage are now sorted by their overall performance (Customer Satisfaction Index).
-
Rewritten result selection controls in angular in preparation of a rewrite of all the result dashboards.
Bugfixes
-
Statuscode
12999is not really an error in WebPagetest. So we excluded it from status codes marking failed tests in OpenSpeedMonitor. -
Filter in Job List view lost entries if some of the jobs ran (page reload needed to see them again).
Hotfix Dockerize
Updated docker image to replace https://github.com/jwilder/dockerize with fork https://github.com/powerman/dockerize. This should fix the issue of a high cpu load, when tailing a log file with dockerize (see here)
v5.1.1
Features
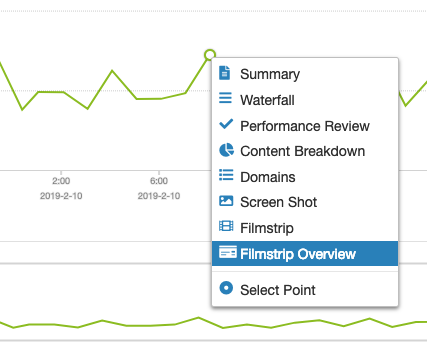
- We integrated the WPT filmstrip tool in our context menu on the time series chart. Now you can directly jump to an overview of the filmstrip and explore test metrics of a WPT test (see this example).
Bugfixes
- Fixed a problem where one couldn't assign roles to existent users.
- Byte metrics where shown in wrong scale on time series chart.
- Some icons in the context menu on time series chart where missing.
- Exporting csv files from results resulted in an error.
Note
Byte metrics will now be persisted correctly. However if you have to fix wrong byte numbers, which were already persisted, use the following script in the groovy console after updating to osm version 5.1.1
(you'll find the groovy console under your-osm-address.de/console after being logged in as root.)
https://gist.github.com/PhilAlbrecht/5152393b1a338b7136bd38a3c6597b43