- Web UI
- Home Tab
- Schedule Tab
- Completed Jobs Tab
- Job Details Tab
- My Account Tab
- Administration Tab
This section describes the Cronicle web user interface. It has been tested extensively in Safari, Chrome and Firefox. Recent versions of IE should also work (11 and Edge).
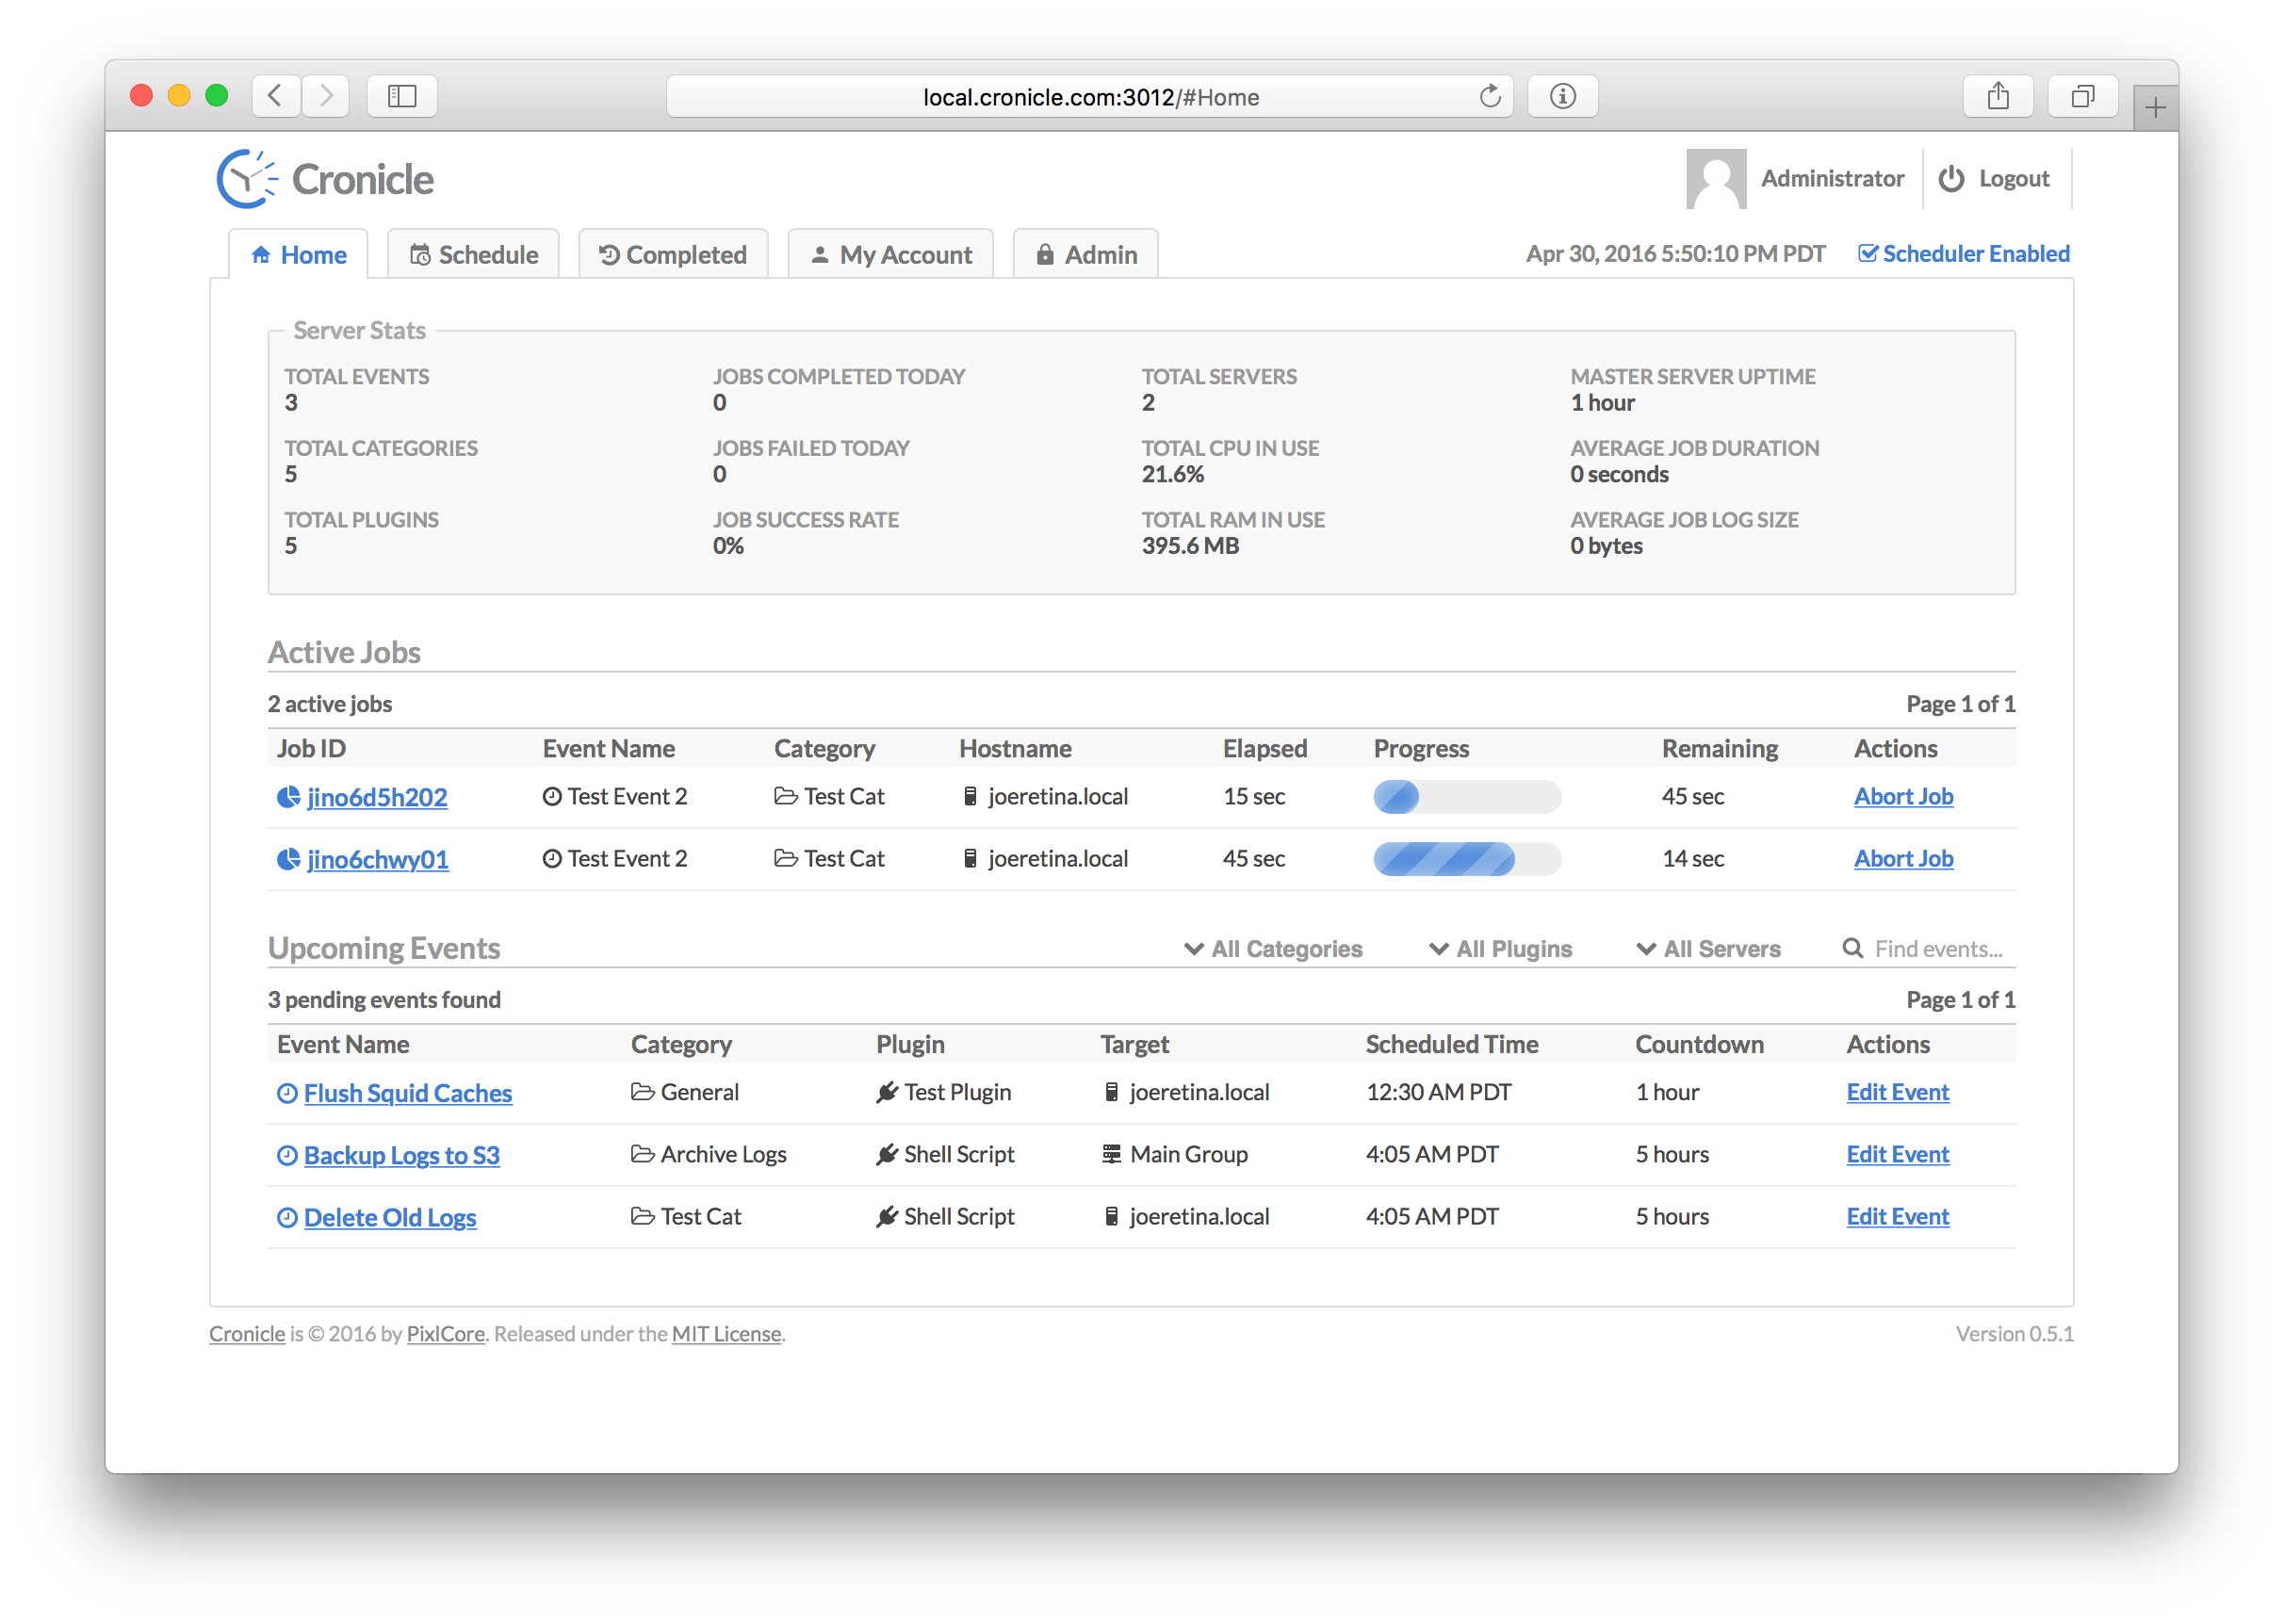
The Home tab, also known as the dashboard, is the default page shown after you log in. It displays basic information about the application, currently active (running) jobs, and a list of upcoming jobs in the next 24 hours. The page is split vertically into three main sections:
This section contains a summary of various Cronicle stats. Some are current totals, and others are daily totals. Here is a list of everything that is displayed:
| Statistic | Description |
|---|---|
| Total Events | Current number of active events in the schedule. |
| Total Categories | Current number of event categories in the system. |
| Total Plugins | Current number of registered Plugins in the system. |
| Jobs Completed Today | Number of jobs completed today (resets at midnight, local server time). |
| Jobs Failed Today | Number of jobs that failed today (resets at midnight, local server time). |
| Job Success Rate | Percentage of completed jobs that succeeded today (resets at midnight, local server time). |
| Total Servers | Current total number of servers in the Cronicle cluster. |
| Total CPU in Use | Current total CPU in use (all servers, all jobs, all processes). |
| Total RAM in Use | Current total RAM in use (all servers, all jobs, all processes). |
| Primary Server Uptime | Elapsed time since Cronicle on the primary server was restarted. |
| Average Job Duration | The average elapsed time for all completed jobs today (resets at midnight, local server time). |
| Average Job Log Size | The average job log file size for all completed jobs today (resets at midnight, local server time). |
This table lists all the currently active (running) jobs, and various information about them. The table columns are:
| Column | Description |
|---|---|
| Job ID | A unique ID assigned to the job. Click this to see live job progress (see Job Details Tab below). |
| Event Name | The name of the scheduled event which started the job. |
| Category | The category to which the event is assigned. |
| Hostname | The server hostname which is running the job. |
| Elapsed | The current elapsed time since the job started. |
| Progress | A visual representation of the job's progress, if available. |
| Remaining | The estimated remaining time, if available. |
| Actions | Click Abort to cancel the job. |
This table lists all the upcoming scheduled events in the next 24 hours, and various information about them. The table columns are:
| Column | Description |
|---|---|
| Event Name | The name of the scheduled event. Click this to edit the event (see Edit Event Tab below). |
| Category | The category to which the event is assigned. |
| Plugin | The Plugin which will be loaded to run the event. |
| Target | The server target (server group or individual server hostname) which will run the event. |
| Scheduled Time | When the event is scheduled to run (in your local timezone unless otherwise specified). |
| Countdown | How much time remains until the event runs. |
| Actions | Click Edit Event to edit the event (see Edit Event Tab below). |
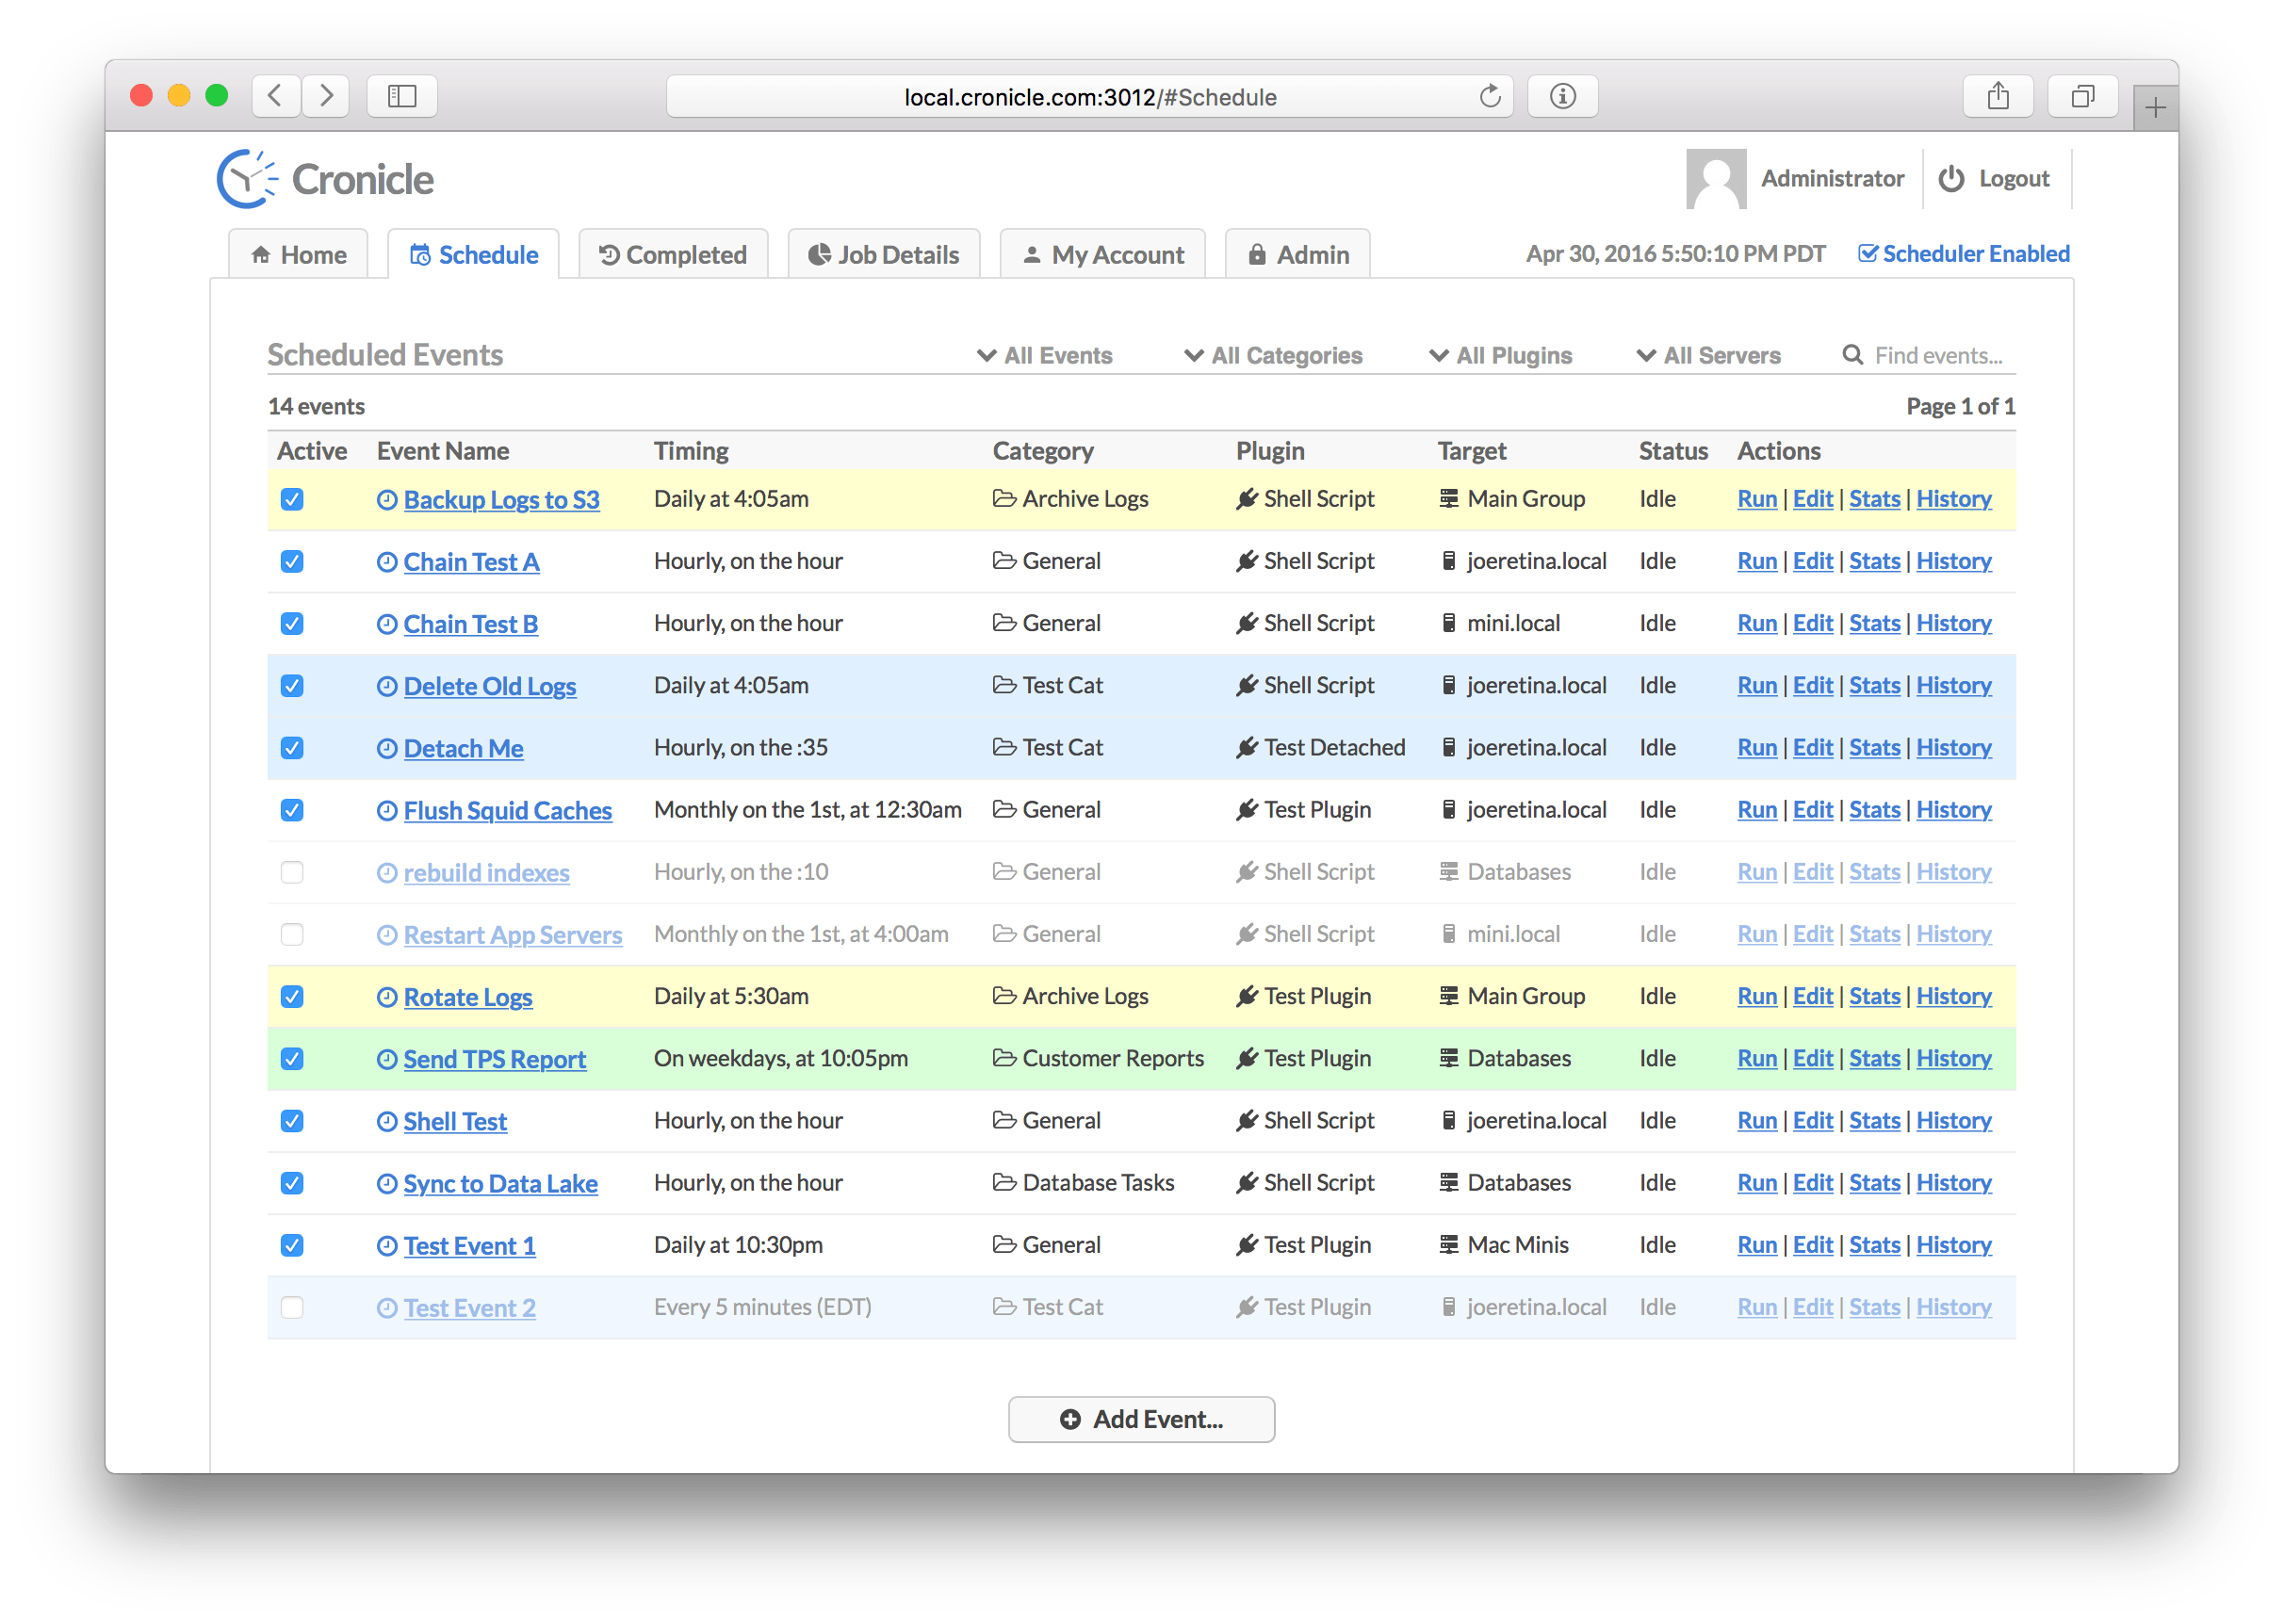
This tab displays the list of all events currently in the schedule, including both active and disabled events. From here you can add new events, edit existing events, run events on-demand, and jump to locations such as Event History and Event Stats. The schedule table has the following columns:
| Column | Description |
|---|---|
| Active | This checkbox indicates whether the event is active or disabled. Click it to toggle the state. |
| Event Name | The name of the scheduled event. Click this to edit the event (see Edit Event Tab below). |
| Timing | A summary of the event's timing settings (daily, hourly, etc.). |
| Category | The category to which the event is assigned. |
| Plugin | The Plugin which will be loaded to run the event. |
| Target | The server target (server group or individual server hostname) which will run the event. |
| Status | Current status of the event (idle or number of running jobs). |
| Actions | A list of actions to run on the event. See below. |
Here are the actions you can run on each event from the Schedule tab:
| Action | Description |
|---|---|
| Run | Immediately runs the event (starts an on-demand job), regardless of the event's timing settings. |
| Edit | This jumps over to the Edit Event Tab to edit the event. |
| Stats | This jumps over to the Event Stats Tab to see statistics about the event and past jobs. |
| History | This jumps over to the Event History Tab to see the event's history of completed jobs. |
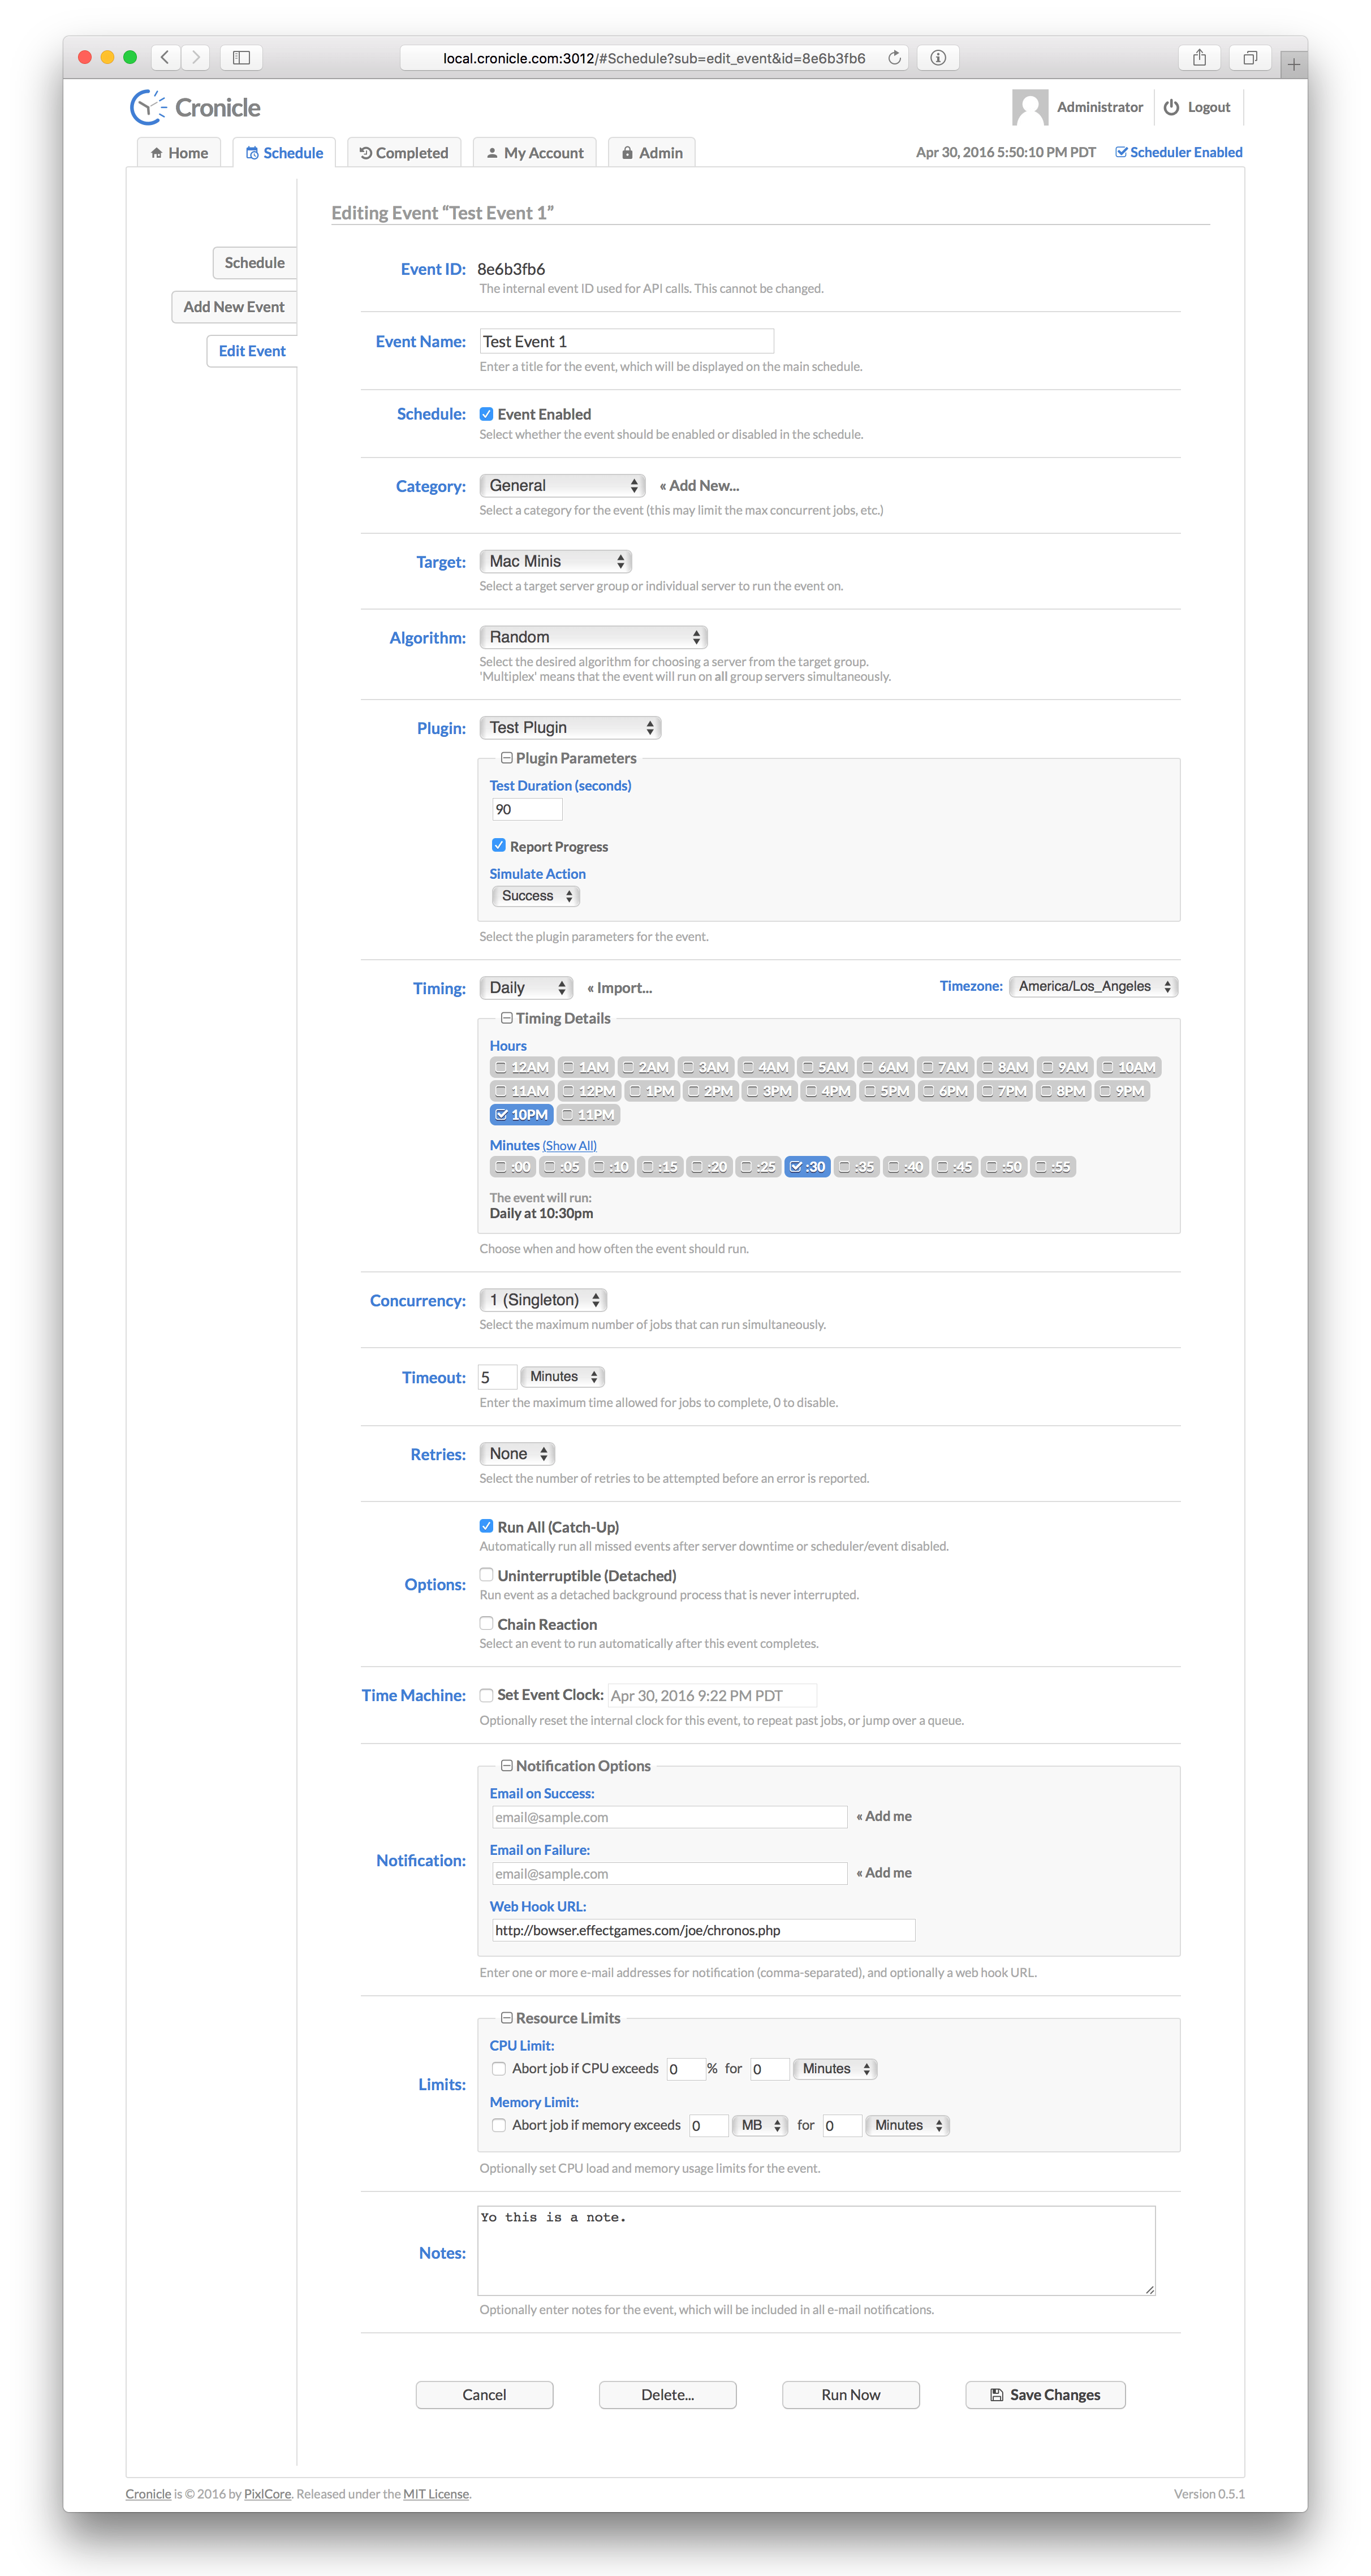
The Edit Event Tab displays a form for editing scheduled events, and creating new ones. Here are all the form fields and what they mean:
Each event has a unique ID which is used when making API calls, and can be ignored otherwise. This is only displayed when editing events.
Each event has a name, which can be anything you like. It is displayed on the Schedule tab, and in reports, e-mails, etc.
This checkbox specifies whether the event is enabled (active) in the scheduler, and will fire off jobs according to the Event Timing, or disabled. If disabled, you can still run on-demand jobs by clicking the "Run Now" button.
All events are assigned to a particular category. If you don't want to create categories, just assign your events to the provided "General" category. Categories can define limits such as max concurrent jobs, max RAM per job and max CPU per job. See the Categories Tab below for more details on creating categories.
In a multi-server cluster, events can be targeted to run on individual servers, or server groups. Both are listed in the drop-down menu. If a server group is targeted, one of the group's servers is chosen each time the event runs a job. You can decide which algorithm to use for picking servers from the group (see below). Also, see the Servers Tab for more details on creating server groups.
When you target a server group for your event, a supplementary menu appears to select an "algorithm". This is simply the method by which Cronicle picks a server in the group to run your job. The default is "Random" (i.e. select a random server from the group for each job), but there are several others as well:
| Algorithm ID | Algorithm Name | Description |
|---|---|---|
random |
Random | Pick a random server from the group. |
round_robin |
Round Robin | Pick each server in sequence (alphabetically sorted). |
least_cpu |
Least CPU Usage | Pick the server with the least amount of CPU usage in the group. |
least_mem |
Least Memory Usage | Pick the server with the least amount of memory usage in the group. |
prefer_first |
Prefer First | Prefer the first server in the group (alphabetically sorted), only picking alternatives if the first server is unavailable. |
prefer_last |
Prefer Last | Prefer the last server in the group (alphabetically sorted), only picking alternatives if the last server is unavailable. |
multiplex |
Multiplex | Run the event on all servers in the group simultaneously (see below). |
If the event targets a server group, you have the option of "multiplexing" it. That is, the event will run jobs on all the servers in the group at once, rather than picking one server at random.
When this feature is enabled, an optional "Stagger" text field will appear. This allows you to stagger (progressively delay) the launch of jobs across the servers, so they don't all start at the same exact time.
Whenever Cronicle runs an event, a "Plugin" is loaded to handle the job. This is basically a shell command which runs as its own process, reads JSON from STDIN to receive metadata about the job, and writes JSON to STDOUT to report progress and completion. Plugins can be written in virtually any language. See the Plugins section below for more details.
If the Plugin defines any custom parameters, they are editable per event. This feature allows the Plugin to define a set of UI elements (text fields, checkboxes, drop-down menus, etc.) which the event editor can provide values for. Then, when jobs are started, the Plugin is provided a JSON document containing all the custom keys and values set by the UI for the event.
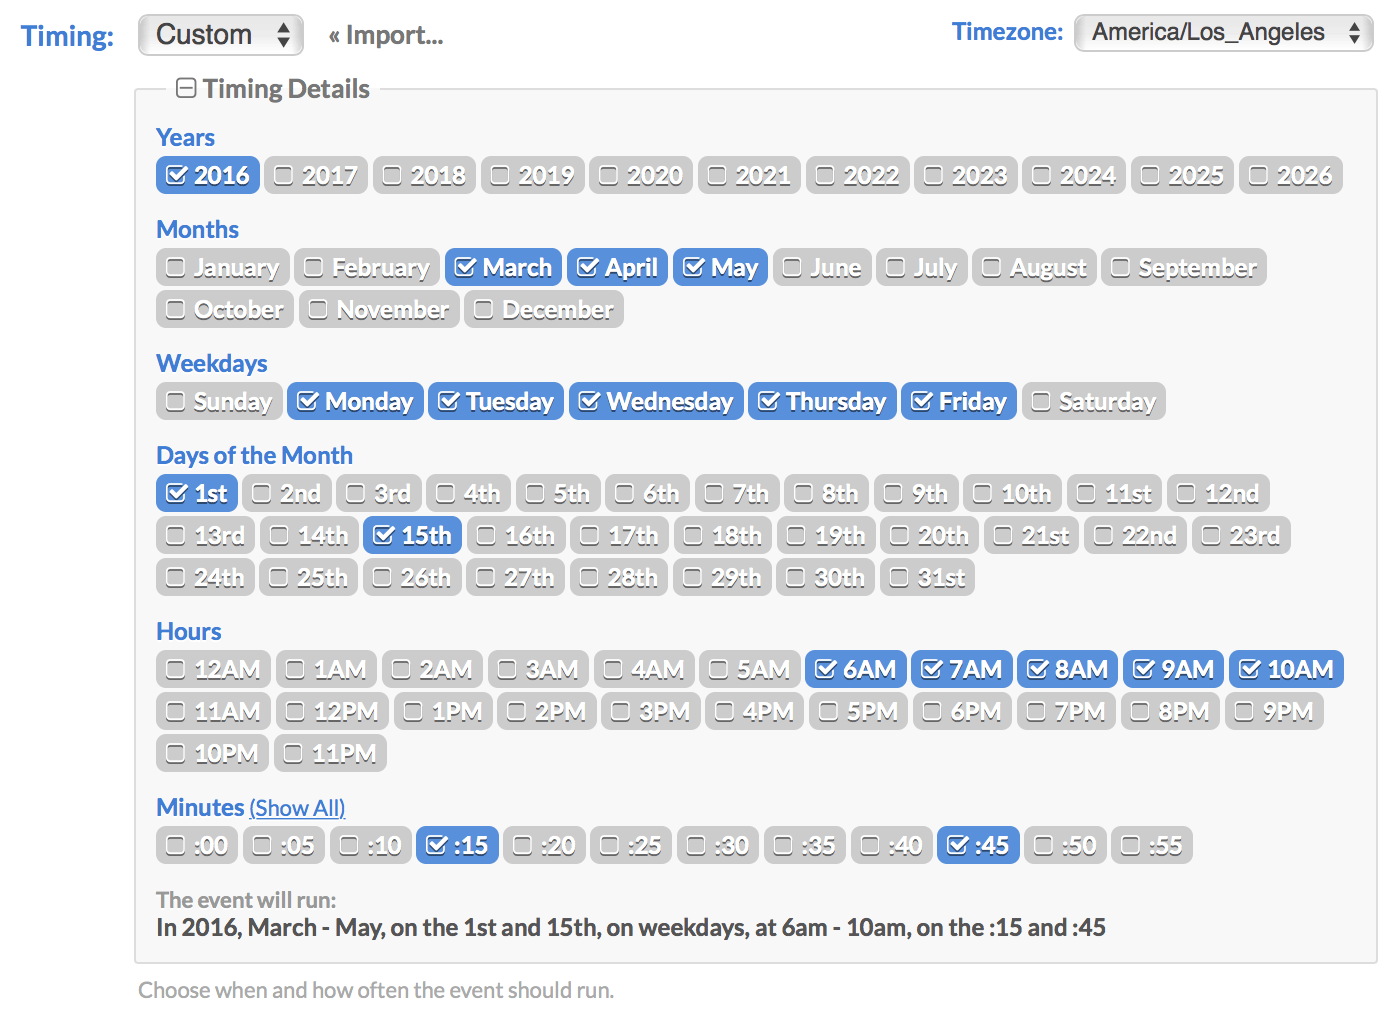
Events are scheduled to run at various dates and times using a visual multi-selector widget, as shown above. This allows you to multi-select any combination of years, months, days, weekdays, hours and/or minutes, for an event to run on. It will also repeat on a recurring basis, each time the server clock matches your selections. This is very similar to the Unix Cron format, but with a more visual user interface.
If you leave all the boxes unchecked in a particular time scale, it means the same as "all" (similar to the Cron asterisk * operator). So if you leave everything blank in all the categories and select only the ":00" minute, it means: every year, every month, every day, every weekday, and every hour on the ":00" minute. Or in other words, hourly.
If you click the "Import..." link, you can import date/time settings from a Crontab, i.e. the famous * * * * * syntax. This saves you the hassle of having to translate your existing Crontabs over to the Cronicle UI by hand.
By default, events are scheduled in your current local timezone, but you can customize this using the menu at the top-right. The menu is pre-populated with all the IANA standard timezones. Also, the timezone selection is saved with each event, so Cronicle always knows exactly when the they should all run, regardless of the server timezone.
The Cronicle scheduling system is versatile, but it can't do everything. For example, you cannot schedule an event to run at two different times on two different days, such as 2:30 PM on Monday and 8:30 AM on Tuesday. For that, you'd have to create separate events.
The Event Concurrency selector allows you to specify how many simultaneous jobs are allowed to run for the event. For example, multiple jobs may need to run if your event is scheduled to run hourly, but it takes longer than a hour to complete a job. Or, a job may be already running and someone clicks the "Run Now" link on the Schedule tab. This selector specifies the maximum allowed jobs to run concurrently for each event.
If an event cannot start a job due to the concurrency limit, an error is logged (see the Activity Log Tab below). What happens next depends on the Event Options. If the event has Run All (Catch-Up) mode enabled, then the scheduler will keep trying to run every scheduled job indefinitely. Otherwise, it will simply wait until the next scheduled run.
You can optionally specify an event timeout, which is a maximum run time for event jobs. If a job takes longer than the specified timeout period, it is aborted, and logged as a failed job. To disable the timeout and allow jobs to run indefinitely, set this field to 0.
If a job throws an internal error (meaning, it returns a non-zero code in the JSON response, or a shell command exits with a non-zero exit code), you can have Cronicle automatically retry it up to 32 times. Aborting a job (either manually or by a timeout) does not trigger a retry.
If the retries is set to a non-zero amount, a "Retry Delay" text field will appear. This allows you to have Cronicle wait a certain amount of time between retries, if you want. The idea is to reduce bashing on services that may be overloaded.
Note that the Event Timeout applies to the total run time of the job, which includes all retries. For example, if you set the timeout to 10 minutes, and the job takes 9 minutes and fails, any retries will then only have 1 minute to complete the job. So please set the timeout accordingly.
This section allows you to select options on how jobs are handled for the event:
When Run All (Catch-Up) Mode mode is enabled on an event, the scheduler will do its best to ensure that every scheduled job will run, even if they have to run late. This is useful for time-sensitive events such as generating reports. So for example, if you have an event scheduled to run hourly, but something prevents it from starting or completing (see below), the scheduler will keep trying indefinitely until each separate hourly job runs. If the event cannot run for multiple hours, the jobs will simply queue up, and the scheduler will run them all in order, as quickly as its rules allow.
If any of the following situations occur, and the event has Run All (Catch-Up) mode enabled, the scheduler will queue up and re-run all missed jobs:
- Job could not run due to concurrency limits.
- Job could not run due to the target server being unavailable.
- Job could not run due to the event category or Plugin being disabled.
- Server running the job was shut down.
- Server running the job crashed.
- Job was aborted due to exceeding a resource limit (RAM or CPU).
The only time a Catch-Up job is not re-run is when one of the following actions occur:
- Job is manually aborted via the Web UI or API.
- Job was aborted due to exceeding a timeout limit (see Issue #369 for explanation).
- Job fails due to error thrown from inside the Plugin (user code generated error).
You can see all queued jobs on the Home Tab. They will be listed in the Upcoming Events table, and have their "Countdown" column set to "Now". To jump over the queue and reset an event that has fallen behind, use the Event Time Machine feature.
When Run All (Catch-Up) mode is disabled, and a job cannot run or fails due to any of the reasons listed above, the scheduler simply logs an error, and resumes normal operations. The event will not run until the next scheduled time, if any. This is more suitable for events that are not time-sensitive, such as log rotation.
When Uninterruptible (Detached) mode is enabled on an event, jobs are spawned as standalone background processes, which are not interrupted for things like the Cronicle daemon restarting. This is designed mainly for critical operations that cannot be stopped in the middle for whatever reason.
Please use this mode with caution, and only when truly needed, as there are downsides. First of all, since the process runs detached and standalone, there are no real-time updates. Meaning, the progress bar and time remaining displays are delayed by up to a minute. Also, when your job completes, there is a delay of up to a minute before Cronicle realizes and marks the job as complete.
It is much better to design your jobs to be interrupted, if at all possible. Note that Cronicle will re-run interrupted jobs if they have Run All Mode set. So Detached Mode should only be needed in very special circumstances.
By default, when jobs cannot run due to concurrency settings, or other issues like an unavailable target server, an error is generated. That is, unless you enable the event queue. With queuing enabled, jobs that can't run immediately are queued up, and executed on a first come, first serve basis, as quickly as conditions allow.
When the queue is enabled on an event, a new "Queue Limit" section will appear in the form, allowing you to set the maximum queue length per event. If this limit is reached, no additional jobs can be queued, and an error will be generated.
You can track the progress of your event queues on the Home Tab. Queued events and counts appear in a table between the Active Jobs and Upcoming Events sections. From there you can also "flush" an event queue (i.e. delete all queued jobs), in case one grows out of control.
Chain Reaction mode allows you to select an event which will be launched automatically each time the current event completes a job. You are essentially "chaining" two events together, so one always runs at the completion of the other. This chain can be any number of events long, and the events can all run on different servers.
You can optionally select different events to run if the current job succeeds or fails. For example, you may have a special error handling / notification event, which needs to run upon specific event failures.
You can have more control over this process by using the JSON API in your Plugins. See Chain Reaction Control below for details.
When editing an existing event that has Run All (Catch-Up) mode enabled, the Event Time Machine will appear. This is a way to reset the internal "clock" for an event, allowing you to re-run past jobs, or skip over a queue of stuck jobs.
For each event in the schedule, Cronicle keeps an internal clock called a "cursor". If you imagine time running along a straight line, the event cursors are points along that line. When the primary server ticks a new minute, it shifts all the event cursors forward up to the current minute, running any scheduled events along the way.
So for example, if you needed to re-run a daily 4 AM report event, you can just edit the cursor clock and set it back to 3:59 AM. The cursor will catch up to the current time as quickly as it can, stopping only to run any scheduled events along the way. You can also use this feature to "jump" over a queue, if jobs have stacked up for an event. Just set the cursor clock to the current time, and the scheduler will resume jobs from that point onward.
The event clock for the Time Machine is displayed and interpreted in the event's currently selected timezone.
Cronicle can optionally send out an e-mail notification to a custom list of recipients for each job's completion (for multiple, separate addresses by commas). You can also specify different e-mail addresses for when job succeeds, vs. when it fails. The e-mails will contain a plethora of information about the event, the job, and the error if applicable. Example email contents:
To: ops@local.cronicle.com
From: notify@local.cronicle.com
Subject: Cronicle Job Failed: Rebuild Indexes

Date/Time: 2015/10/24 19:47:50 (GMT-7)
Event Title: Rebuild Indexes
Category: Database
Server Target: db01.prod
Plugin: DB Indexer

Job ID: jig5wyx9801
Hostname: db01.prod
PID: 4796
Elapsed Time: 1 minute, 31 seconds
Performance Metrics: scale=1&total=30.333&db_query=1.699&db_connect=1.941&log_read=2.931&gzip_data=3.773
Memory Usage: 274.5 MB Avg, 275.1 MB Peak
CPU Usage: 31.85% Avg, 36.7% Peak
Error Code: 999

Error Description:
Failed to write to file: /backup/db/schema.sql: Out of disk space

Job Details:
http://local.syncronic.com:3012/#JobDetails?id=jig5wyx9801

Job Debug Log (18.2 K):
http://local.syncronic.com:3012/api/app/get_job_log?id=jig5wyx9801

Edit Event:
http://local.syncronic.com:3012/#Schedule?sub=edit_event&id=3c182051

Event Notes:
This event handles reindexing our primary databases nightly.
Contact Daniel in Ops for details.

Regards,
The Cronicle Team
You have control over much of the content of these e-mails. The Error Code and Description are entirely generated by your own Plugins, and can be as custom and verbose as you want. The Performance Metrics are also generated by your Plugins (if applicable), and the Event Notes are taken straight from the UI for the event (see Event Notes below). Finally, the entire e-mail template can be customized to including additional information or to fit your company's brand. HTML formatted e-mails are supported as well.
See the Email Configuration section for more details on customization.
Another optional notification method for events is a "web hook". This means Cronicle will send an HTTP POST to a custom URL that you specify, both at the start and the end of each job, and include full details in JSON format. Your own API endpoint will receive the JSON POST from Cronicle, and then your code can fire off its own custom notification.
You can determine if the request represents a start or the end of a job by looking at the action property. It will be set to job_start or job_complete respectively. Here is a list of all the JSON properties that will be included in the web hook, and what they mean:
| JSON Property | Description |
|---|---|
action |
Specifies whether the web hook signifies the start (job_start) or end (job_complete) of a job. |
base_app_url |
The base_app_url configuration property. |
category |
The Category ID to which the event is assigned. |
category_title |
The title of the Category to which the event is assigned. |
code |
The response code as specified by your Plugin (only applicable for job_complete hooks). |
cpu |
An object representing the min, max, average and latest CPU usage for the job (only applicable for job_complete hooks). |
description |
A custom text string populated by your Plugin, typically contains the error message on failure. |
edit_event_url |
A fully-qualified URL to edit the event in the Cronicle UI. |
elapsed |
The total elapsed time for the job, in seconds (only applicable for job_complete hooks). |
event |
The ID of the event which spawned the job. |
event_title |
The title of the event which spawned the job. |
hostname |
The hostname of the server which ran (or is about to run) the event. |
id |
An auto-assigned unique ID for the job, which can be used in API calls to query for status. |
job_details_url |
A fully-qualified URL to view the job details in the Cronicle UI. |
log_file_size |
The size of the job's log file in bytes (only applicable for job_complete hooks). |
mem |
An object representing the min, max, average and latest memory usage for the job (only applicable for job_complete hooks). |
nice_target |
Will be set to the title of the target server group, or exact server hostname, depending on how the event is configured. |
params |
An object containing all the UI selections for the Plugin custom parameters, from the event. |
perf |
An object or string containing performance metrics, as reported by your Plugin (only applicable for job_complete hooks). |
pid |
The Process ID (PID) of the main job process which ran your Plugin code (only applicable for job_complete hooks). |
plugin |
The ID of the Plugin assigned to the event. |
plugin_title |
The title of the Plugin assigned to the event. |
source |
A string describing who or what started the job (user or API). Will be blank if launched normally by the scheduler. |
text |
A simple text string describing the action that took place. Useful for Slack Webhook Integrations. |
time_end |
The Epoch timestamp of when the job ended (only applicable for job_complete hooks). |
time_start |
The Epoch timestamp of when the job started. |
Here is an example web hook JSON record (job_complete version shown):
{
	"action": "job_complete",
	"base_app_url": "http://localhost:3012",
	"category": "general",
	"category_title": "General",
	"code": 0,
	"cpu": {
		"min": 23.4,
		"max": 23.4,
		"total": 23.4,
		"count": 1,
		"current": 23.4
	},
	"description": "Success!",
	"edit_event_url": "http://localhost:3012/#Schedule?sub=edit_event&id=3c182051",
	"elapsed": 90.414,
	"event": "3c182051",
	"event_title": "Test Event 2",
	"hostname": "joeretina.local",
	"id": "jihuyalli01",
	"job_details_url": "http://localhost:3012/#JobDetails?id=jihuyalli01",
	"log_file_size": 25119,
	"mem": {
		"min": 190459904,
		"max": 190459904,
		"total": 190459904,
		"count": 1,
		"current": 190459904
	},
	"nice_target": "joeretina.local",
	"params": {
		"db_host": "idb01.mycompany.com",
		"verbose": 1,
		"cust": "Marketing"
	},
	"perf": "scale=1&total=90.103&db_query=0.237&db_connect=6.888&log_read=9.781&gzip_data=12.305&http_post=14.867",
	"pid": 72589,
	"plugin": "test",
	"plugin_title": "Test Plugin",
	"source": "Manual (admin)",
	"text": "Job completed successfully on joeretina.local: Test Event 2 http://localhost:3012/#JobDetails?id=jihuyalli01",
	"time_end": 1449431930.628,
	"time_start": 1449431840.214
}
In addition to job_start and job_complete, there is one other special hook action that may be sent, and that is job_launch_failure. This happens if a scheduled event completely fails to start a job, due to an unrecoverable error (such as an unavailable target server or group). In this case the code property will be non-zero, and the description property will contain a summary of the error.
Only a small subset of the properties shown above will be included with a job_launch_failure, as a job object was never successfully created, so there will be no hostname, pid, elapsed, log_file_size, etc.
To include custom HTTP request headers with your web hook, append them onto the end of the URL using this format: [header: My-Header: My-Value]. Make sure to include a space before the opening bracket. Example URL:
https://myserver.com/api/chat.postMessage [header: My-Header: My-Value]
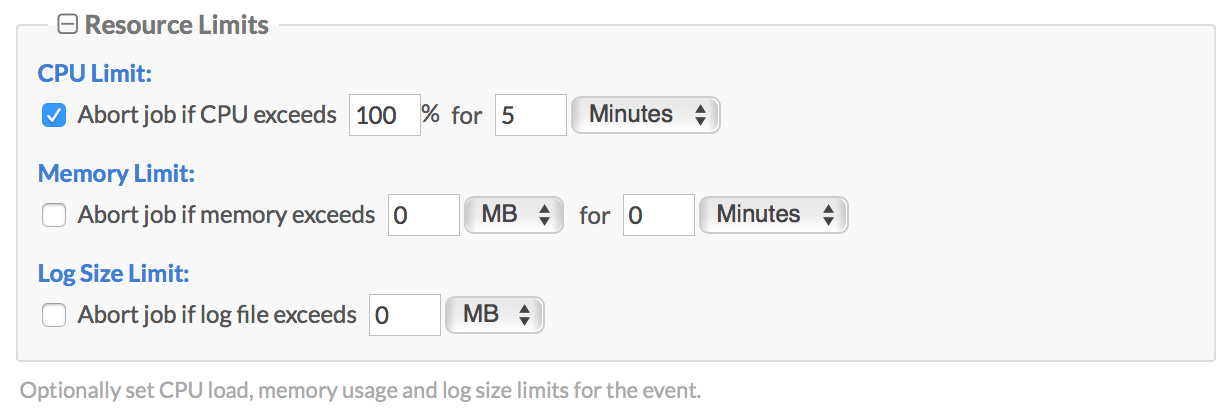
Cronicle can automatically limit the server resource consumption of your jobs, by monitoring their CPU, memory and/or log file size, and aborting them if your limits are exceeded. You can also specify "sustain" times for CPU and memory, so no action is taken until the limits are exceeded for a certain amount of time.
CPU and RAM usage are measured every 10 seconds, by looking at the process spawned for the job, and any child processes that may have also been spawned by your code. So if you fork your own child subprocess, or shell out to a command-line utility, all the memory is totaled up, and compared against the resource limits for the job.
Event notes are for your own internal use. They are displayed to users when editing an event, and in all e-mails regarding successful or failed jobs. For example, you could use this to describe the event to members of your team who may not be familiar, and possibly provide a link to other documentation. There is no character limit, so knock yourself out.
To run an event immediately, click the Run Now button. This will run the current event regardless of its timing settings, and whether the event is enabled or disabled in the schedule. This is simply an on-demand job which is created and executed right away.
If you need to customize the internal clock for the job, hold Shift which clicking the Run Now button. This will bring up a dialog allowing you to set the date and time which the Plugin will see as the "current time", for your on-demand job only. It will not affect any other jobs or the event itself. This is useful for re-running past jobs with a Plugin that honors the now timestamp in the job data.
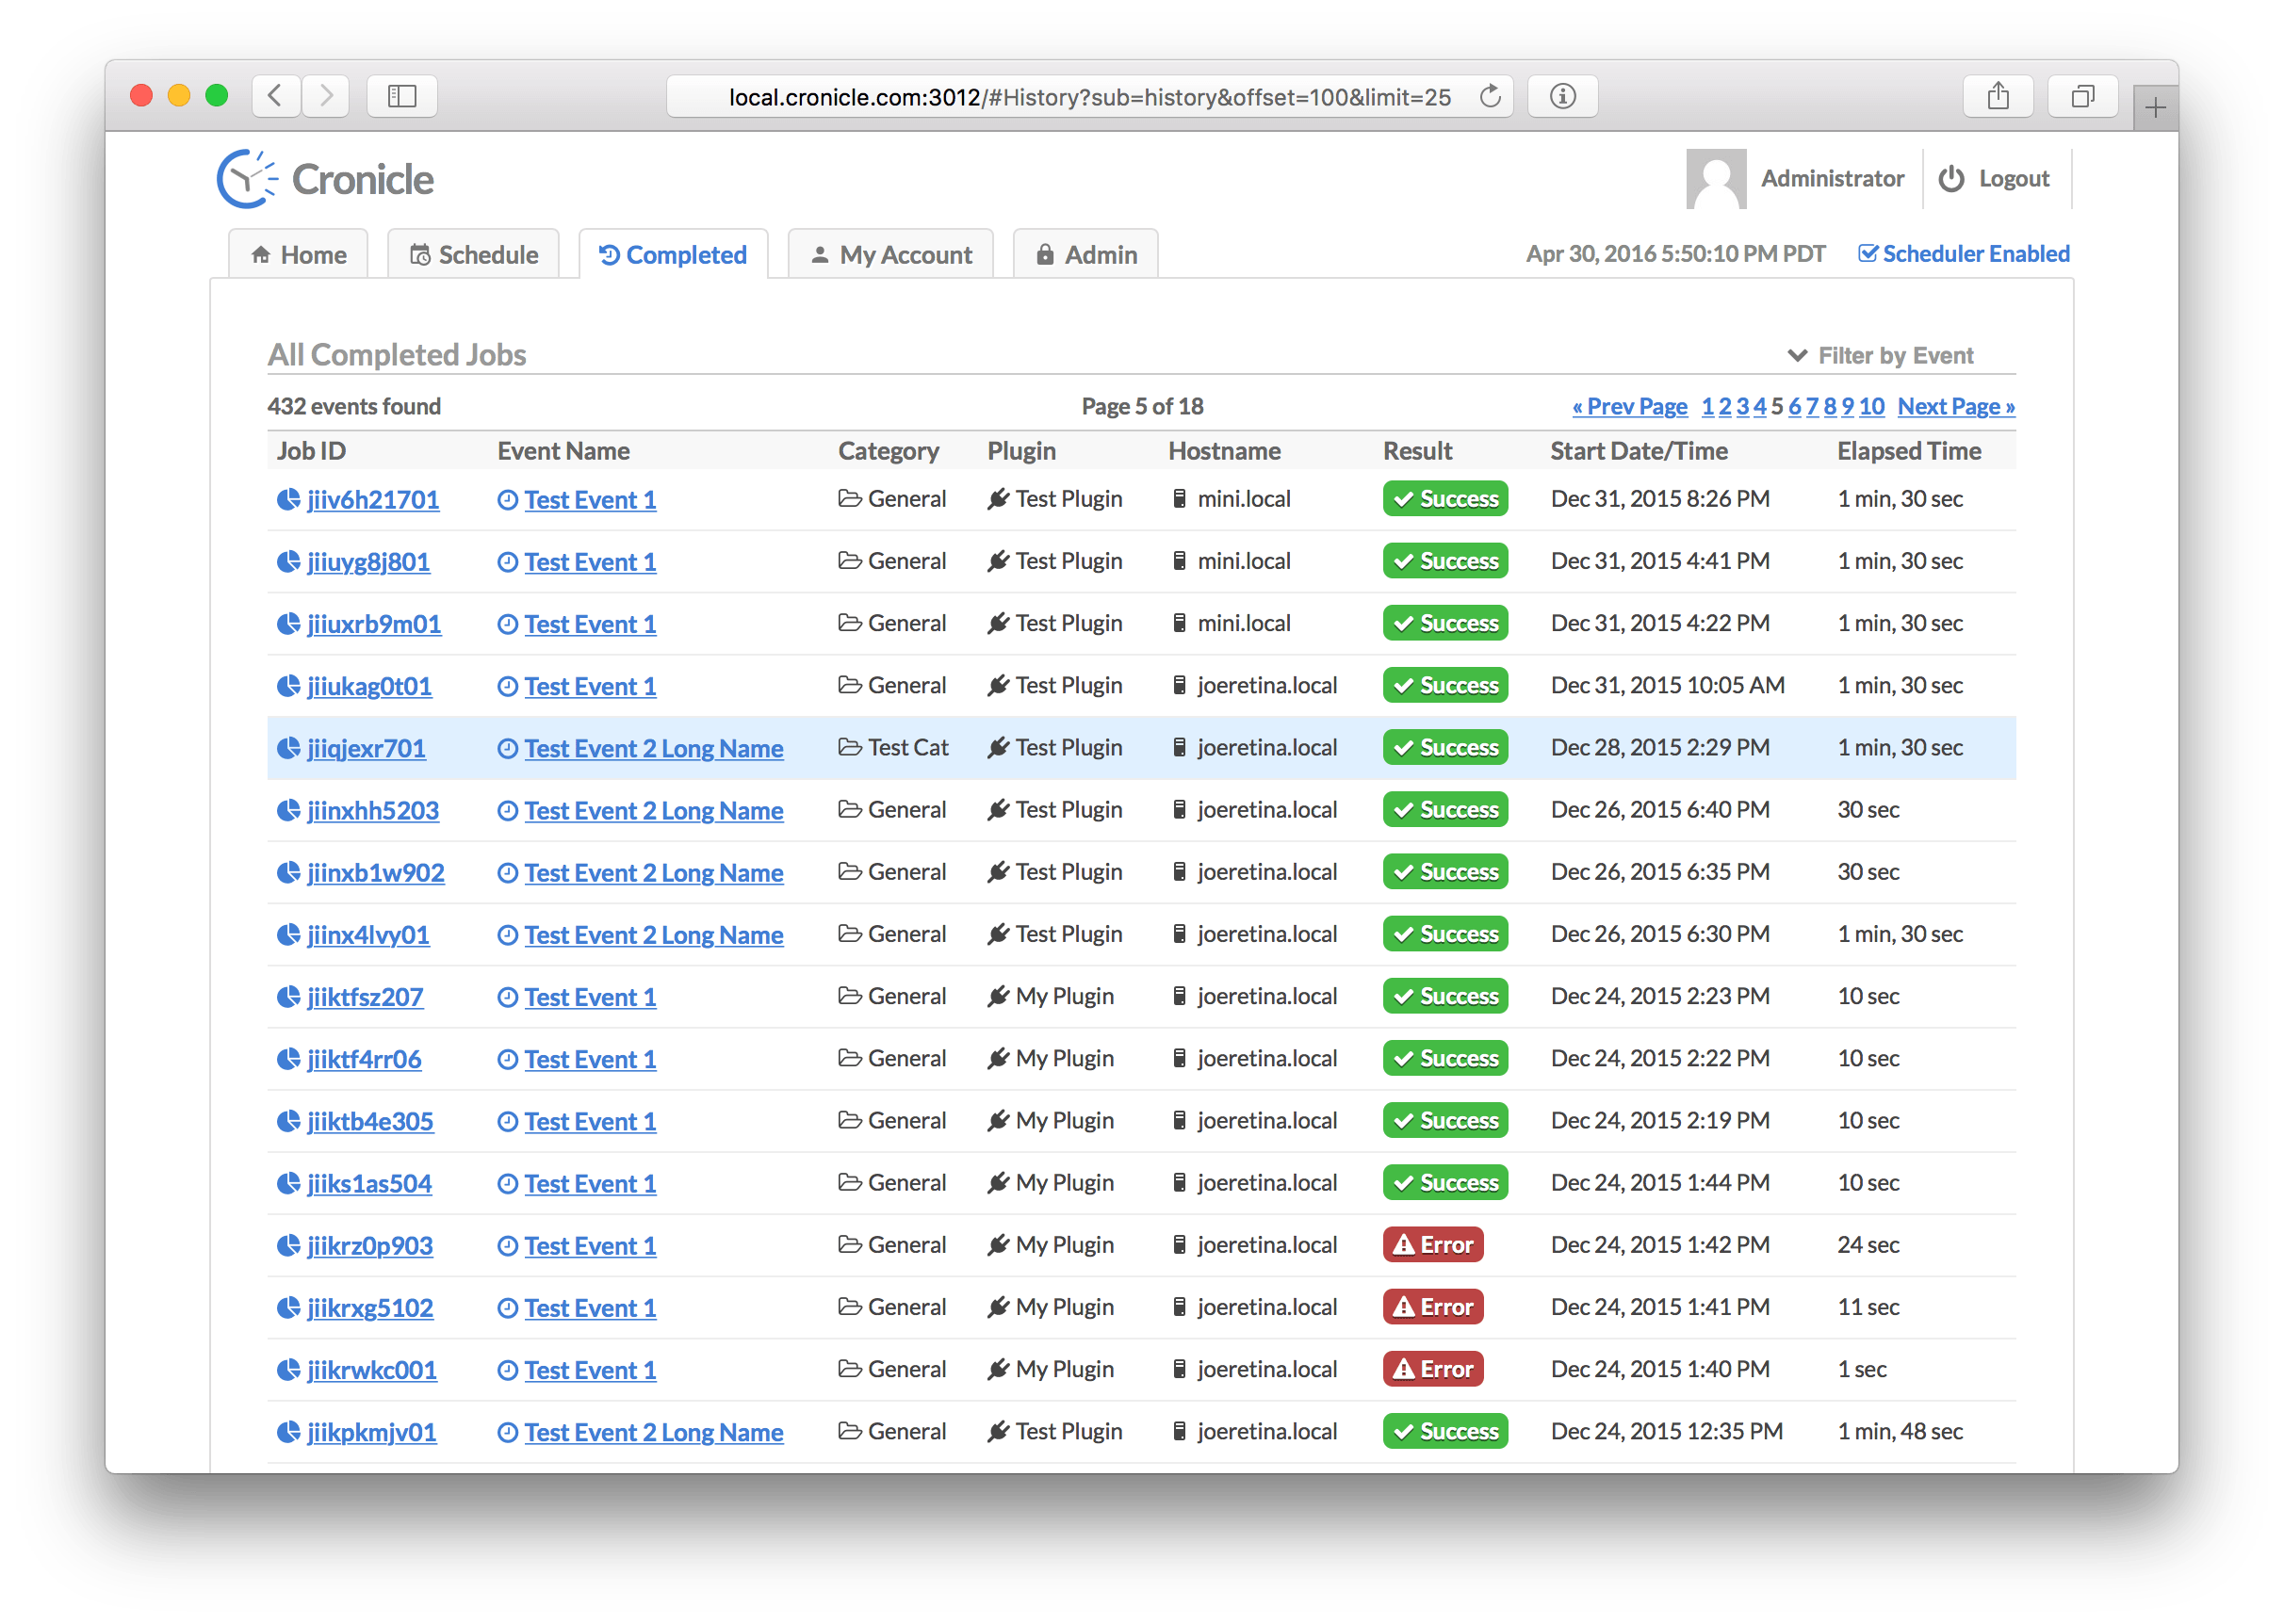
This tab shows you all recently completed jobs, for all events, and whether they succeeded or failed. Cronicle will keep up to list_row_max job completions in storage (default is 10,000). The jobs are sorted by completion date/time, with the latest at the top. Use the pagination controls on the top right to jump further back in time. The table columns are:
| Column | Description |
|---|---|
| Job ID | A unique ID assigned to the job. Click this to see details (see Job Details Tab below). |
| Event Name | The name of the scheduled event for the job. Click this to see the event history (see Event History Tab below). |
| Category | The category to which the event is assigned. |
| Plugin | The Plugin which was used to run the job. |
| Hostname | The hostname of the server which ran the job. |
| Result | This shows whether the job completed successfully, or returned an error. |
| Start Date/Time | The date/time when the job first started. |
| Elapsed Time | The total elapsed time of the job (including any retries). |
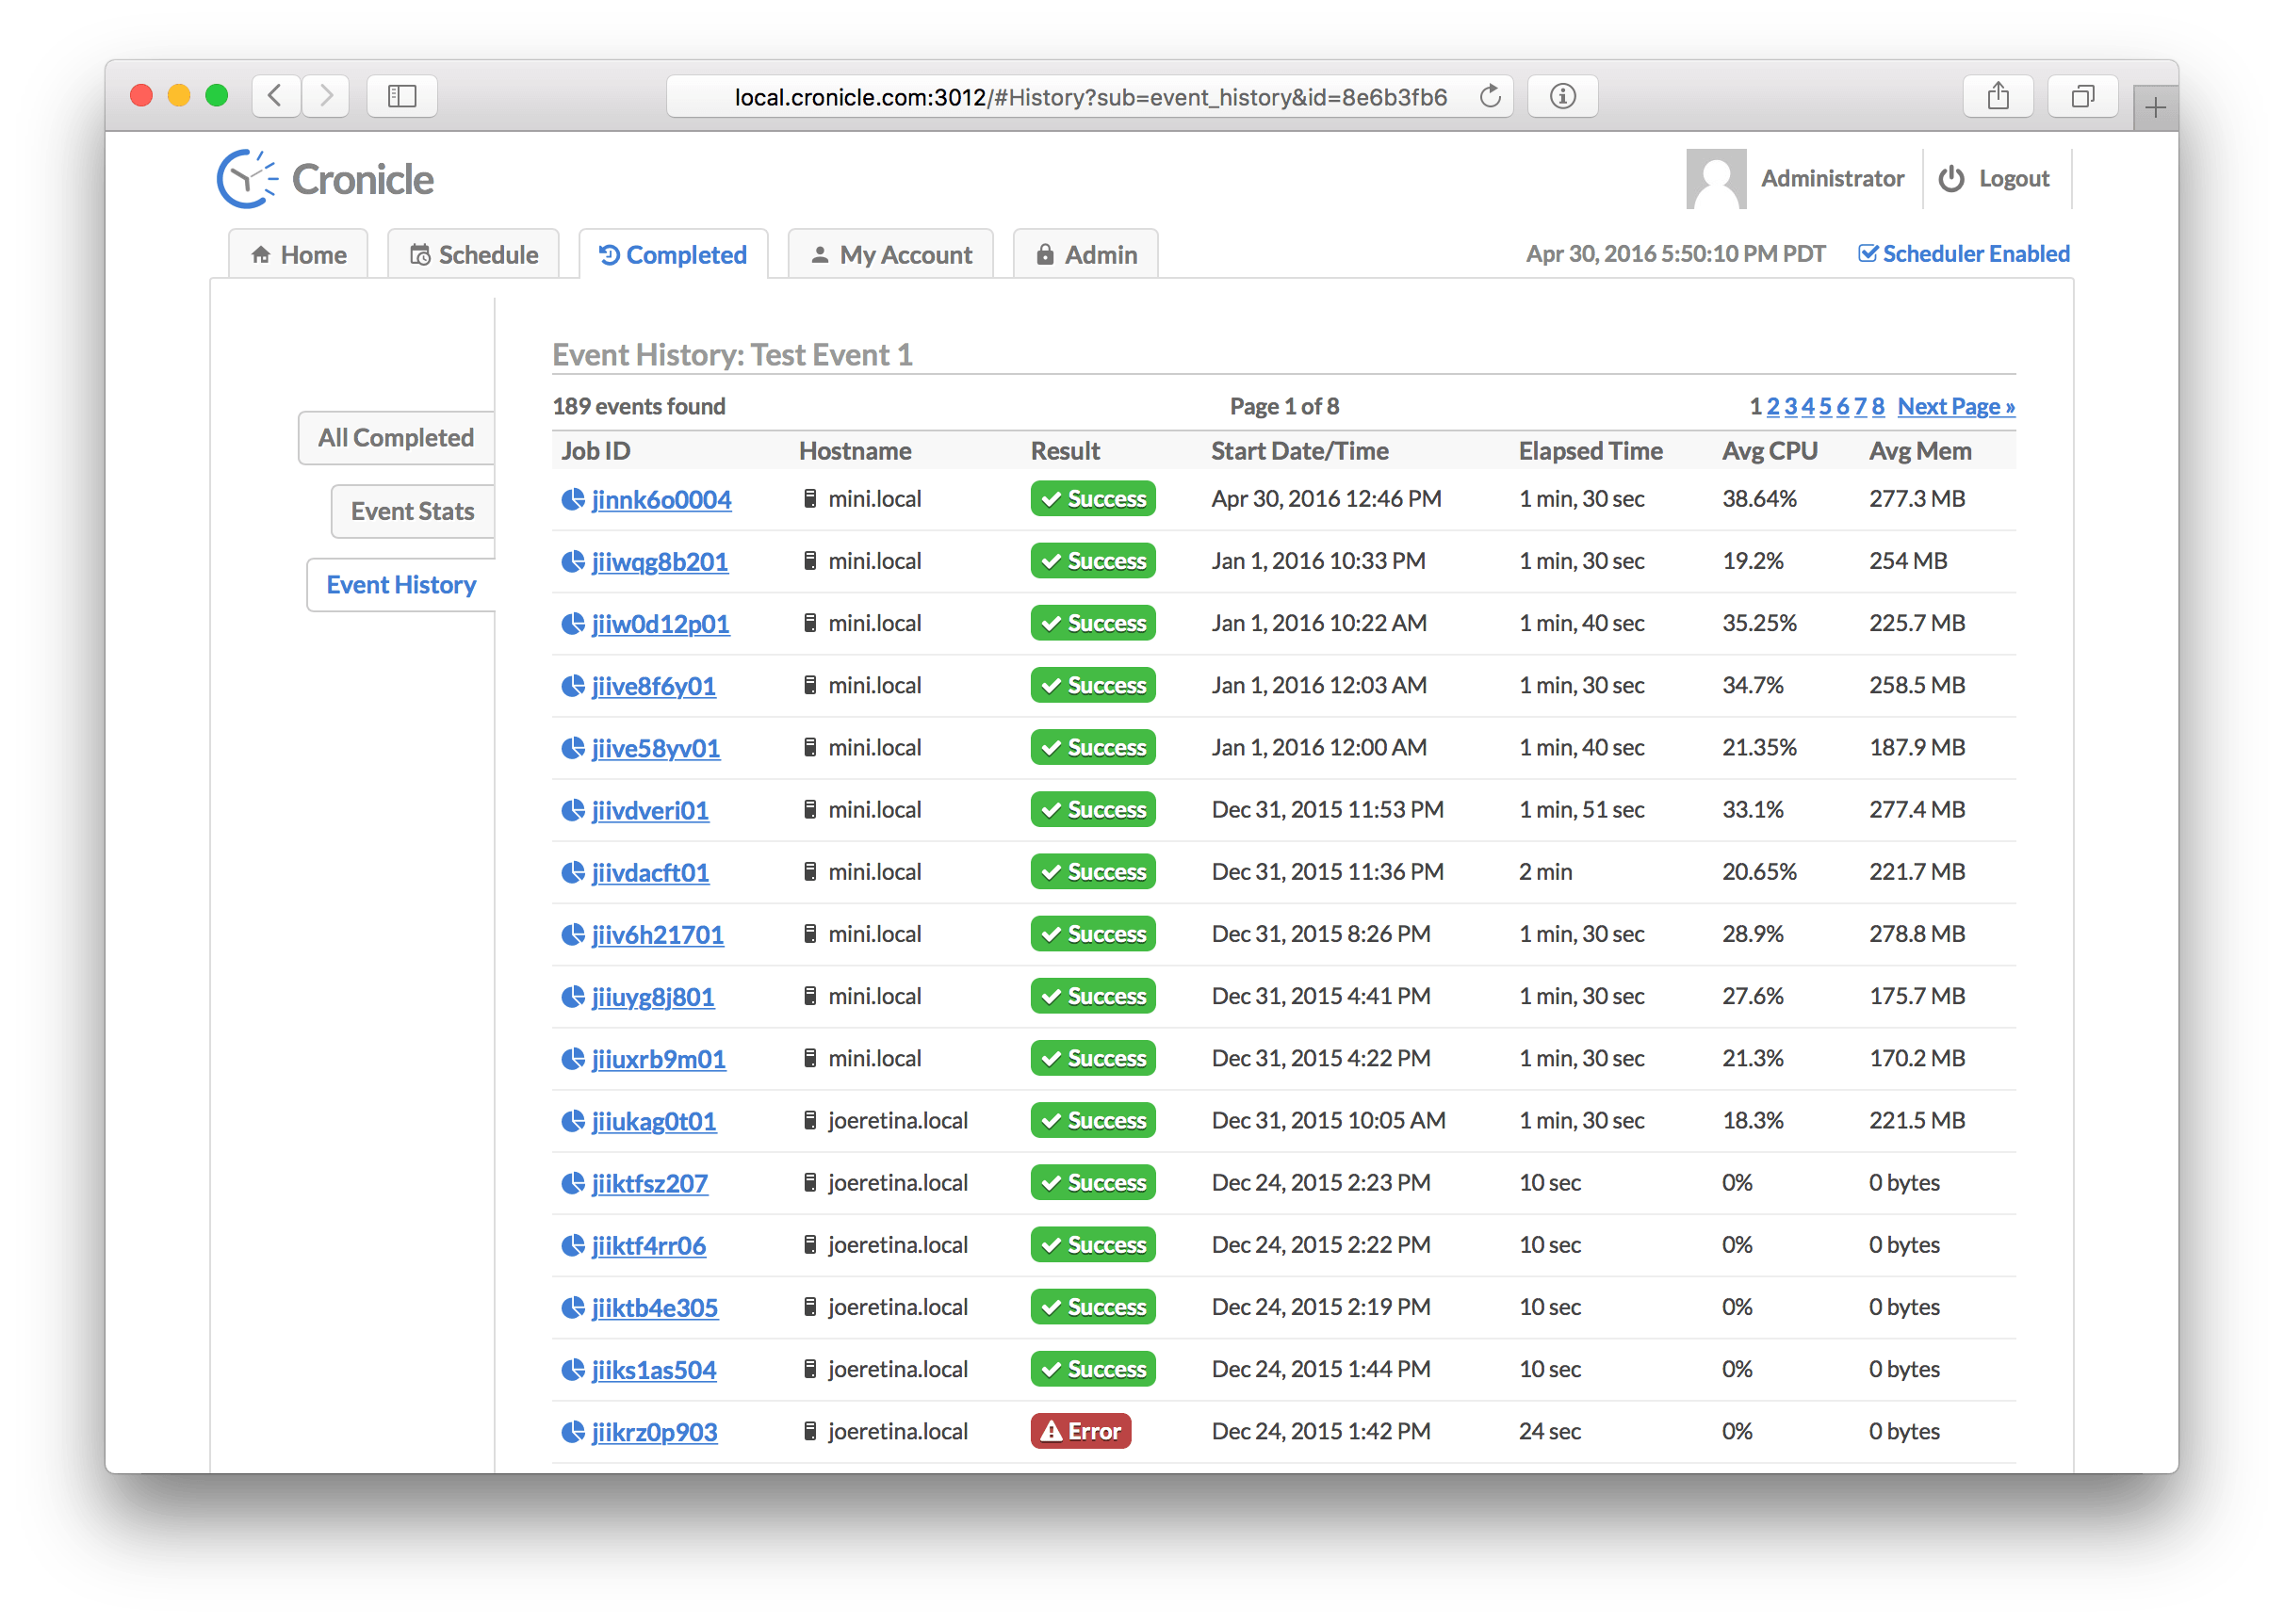
This tab shows you all recently completed jobs for one specific event. Cronicle will keep up to list_row_max job completions in storage (default is 10,000). The jobs are sorted by completion date/time, with the latest at the top. Use the pagination controls on the top right to jump further back in time. The table columns are:
| Column | Description |
|---|---|
| Job ID | A unique ID assigned to the job. Click this to see details (see Job Details Tab below). |
| Hostname | The hostname of the server which ran the job. |
| Result | This shows whether the job completed successfully, or returned an error. |
| Start Date/Time | The date/time when the job first started. |
| Elapsed Time | The total elapsed time of the job (including any retries). |
| Avg CPU | The average CPU percentage used by the job process (including any subprocesses), where 100% equals one CPU core. |
| Avg Mem | The average memory used by the job process (including any subprocesses). |
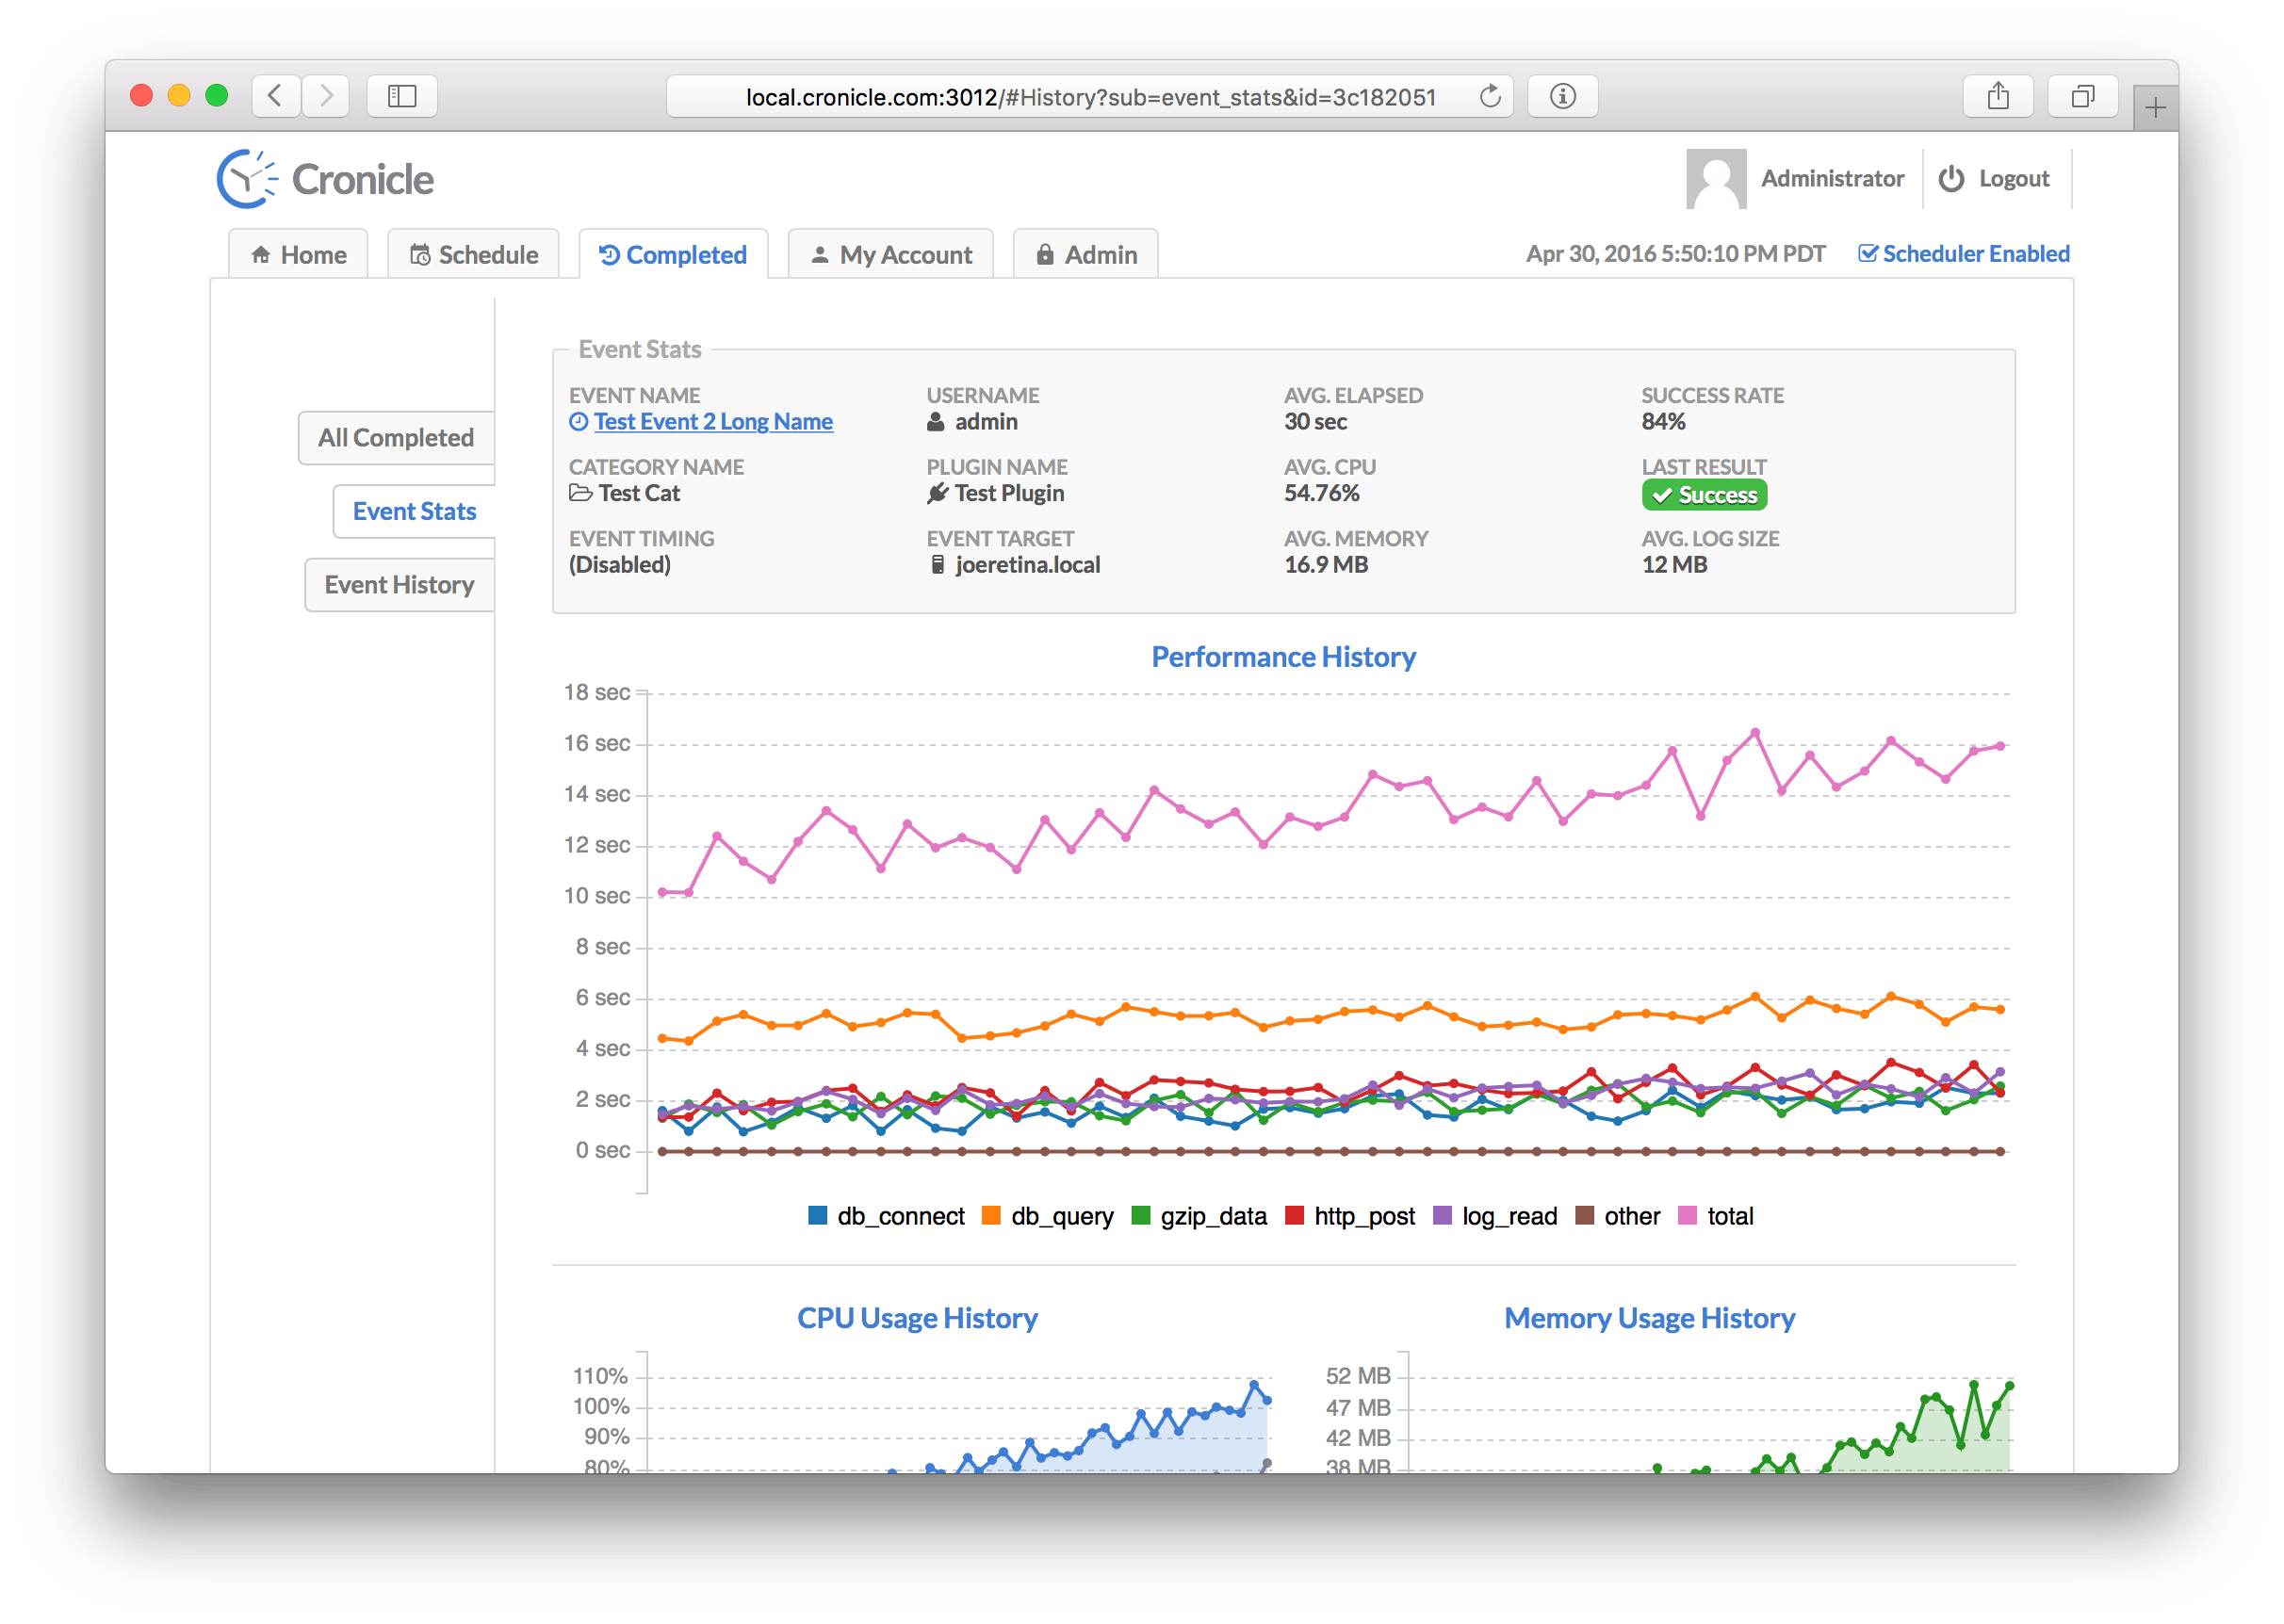
This tab contains statistics about a specific event, including basic information and performance graphs. The data is calculated from the last 50 completed jobs. Here is a list of all the stats that are displayed at the top of the screen:
| Statistic | Description |
|---|---|
| Event Name | The name of the event being displayed. |
| Category Name | The category to which the event is assigned. |
| Event Timing | The timing settings for the event (daily, hourly, etc.). |
| Username | The username of the user who first created the event. |
| Plugin Name | The Plugin selected to run jobs for the event. |
| Event Target | The server group or individual server selected to run jobs for the event. |
| Avg. Elapsed | The average elapsed time of jobs for the event. |
| Avg. CPU | The average CPU used by jobs for the event. |
| Avg. Memory | The average RAM used by jobs for the event. |
| Success Rate | The success percentage rate of jobs for the event. |
| Last Result | Shows the result of the latest job completion (success or fail). |
| Avg. Log Size | The average log file size of jobs for the event. |
Below the stats are a number of graphs:
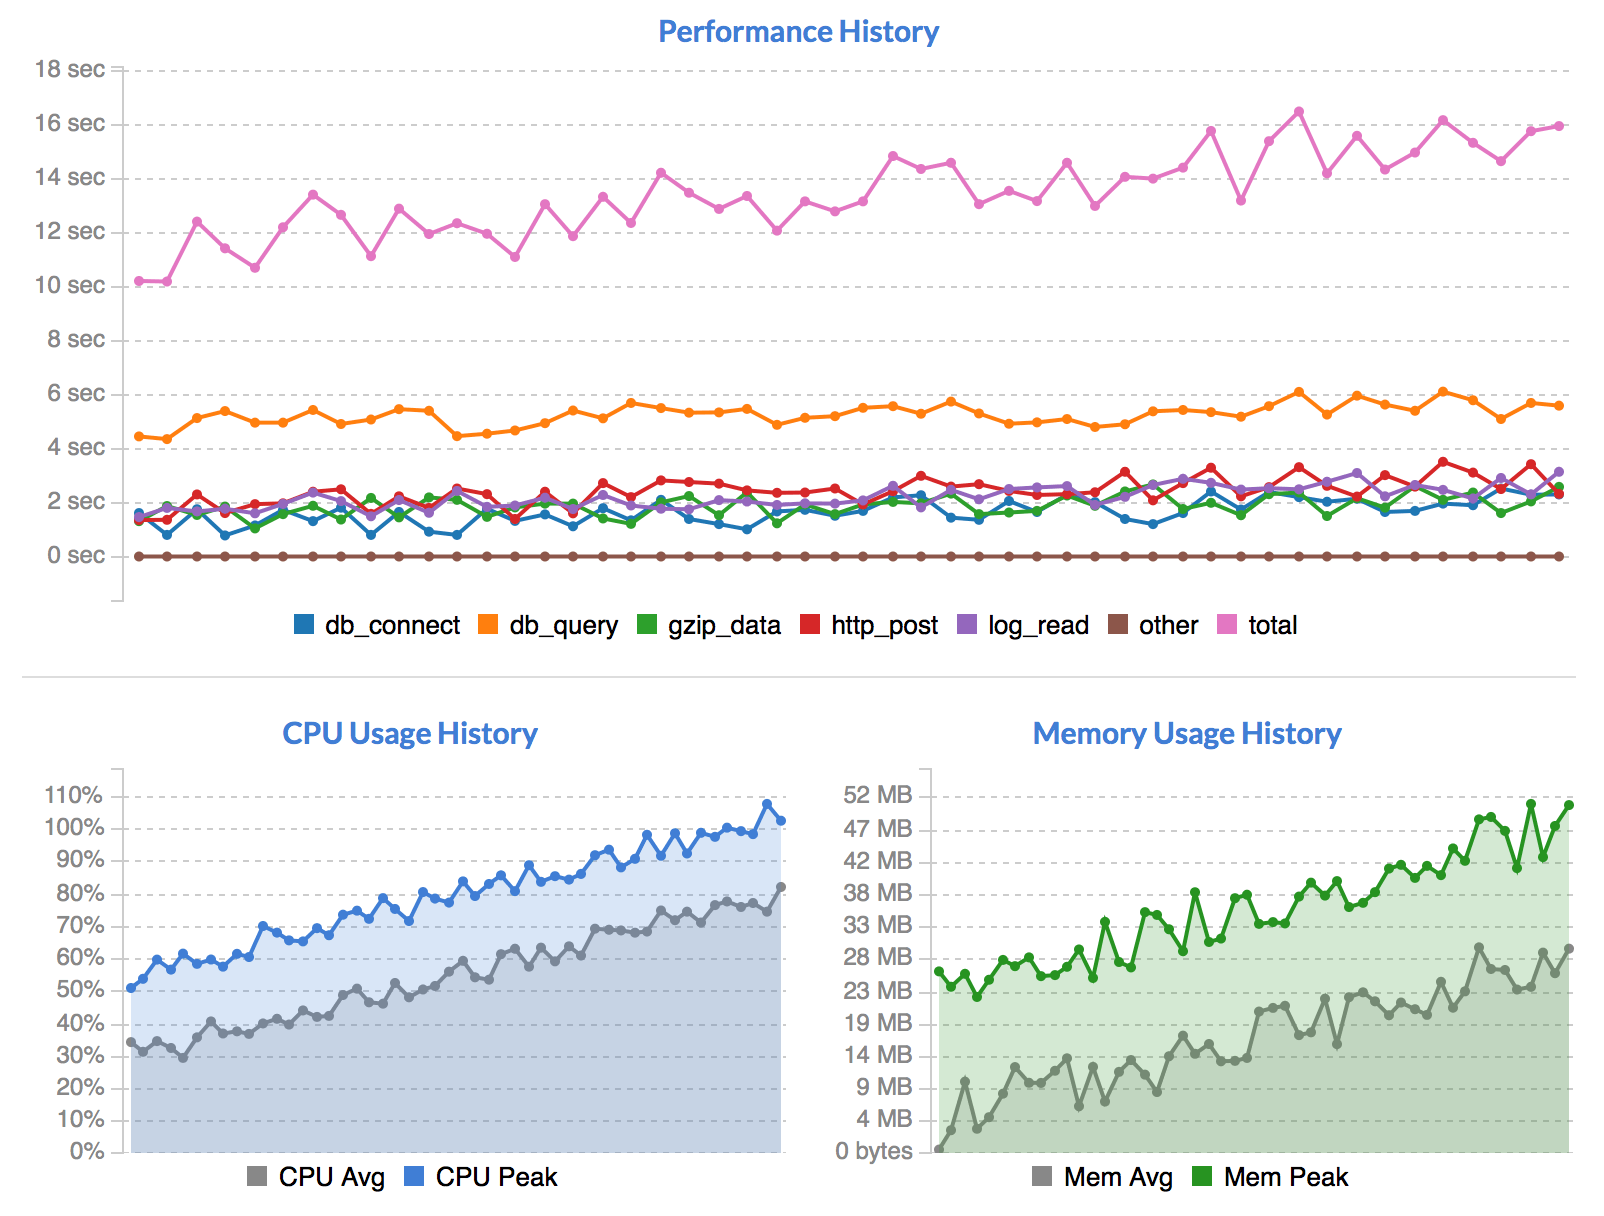
The first graph shows performance of your Plugin's metrics over time. The different categories shown are entirely driven by your custom code. You can choose to provide performance metrics or not, and add as many custom categories as you like. For details, see the Writing Plugins and Performance Metrics sections below.
Below the performance history graph are the CPU Usage History and Memory Usage History graphs. These display your event's server resource usage over time. Each dot on the graph is a particular job run, and the history goes back for 50 runs, if available.
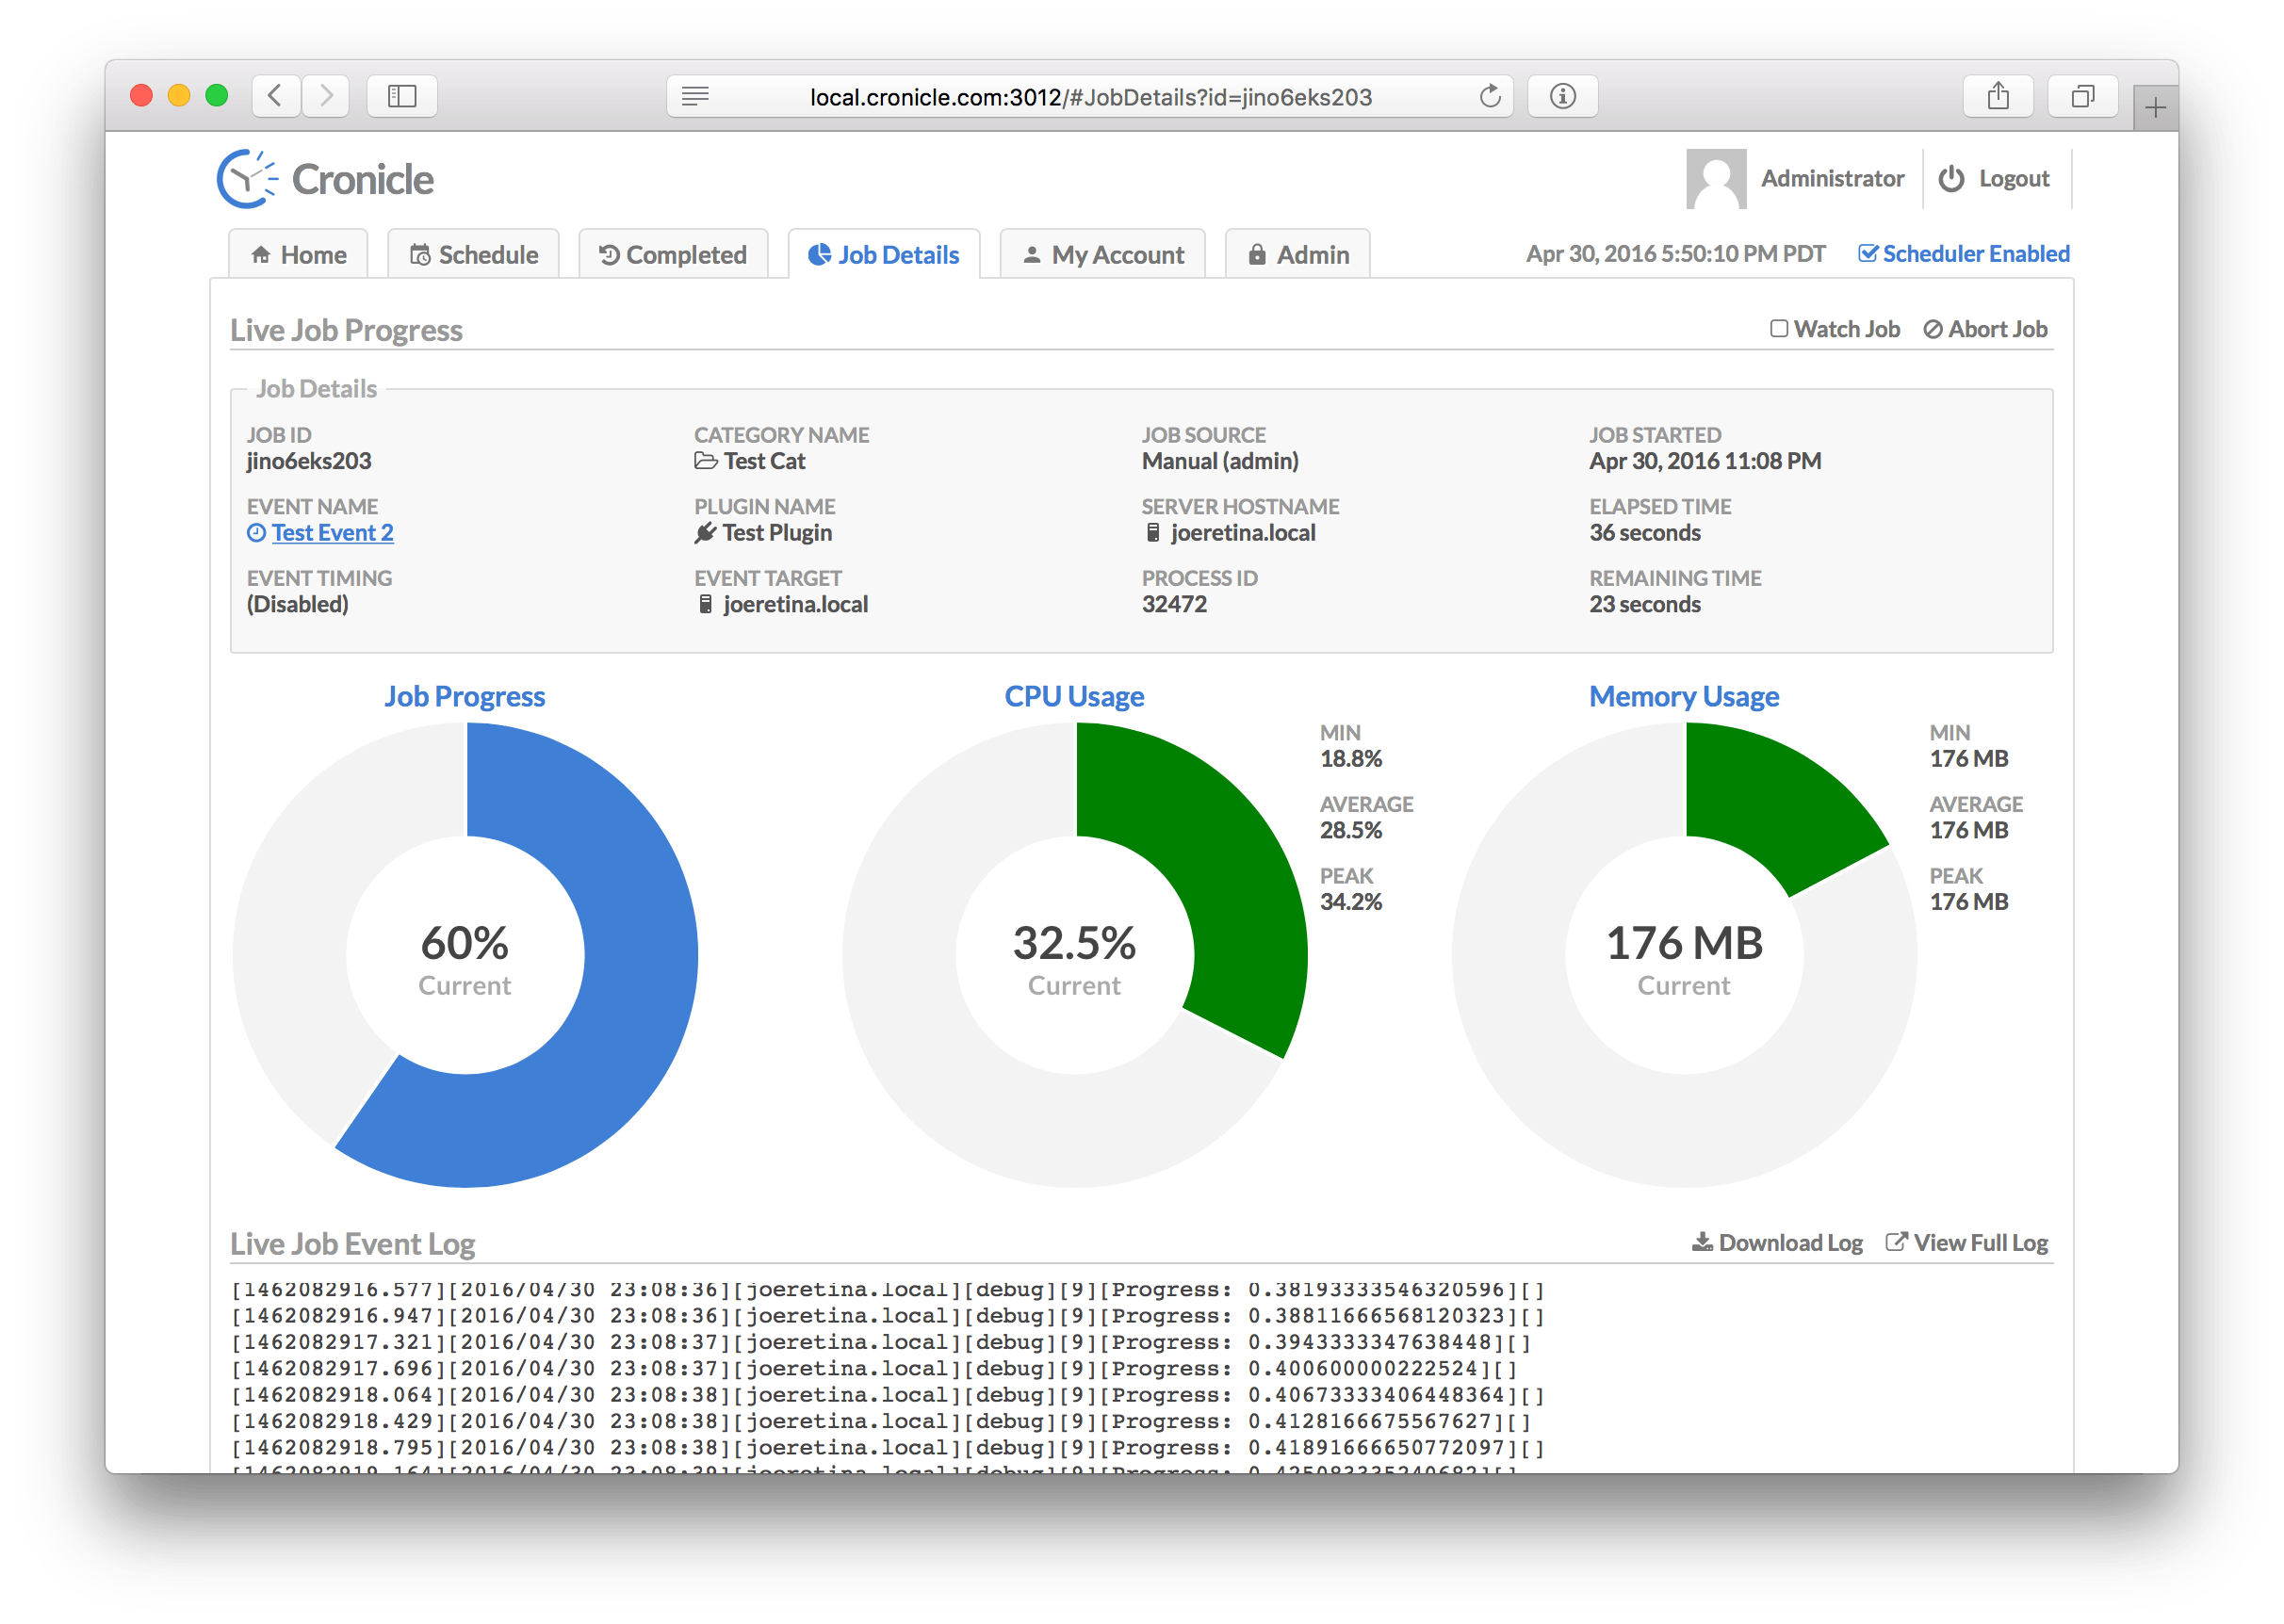
The Job Details Tab is used to view jobs currently in progress, and to see details about completed jobs. The display is slightly different for each case. For jobs in progress, you'll see some statistics about the job which are updated live (see below), and three large donut charts: The current job progress (if provided by the Plugin), and the current CPU and memory usage of the job. Below the donuts you'll find the live job log file, updated in real-time. The stats consist of:
| Statistic | Description |
|---|---|
| Job ID | A unique ID assigned to the job. |
| Event Name | The name of the event being displayed. |
| Event Timing | The timing settings for the event (daily, hourly, etc.). |
| Category Name | The category to which the event is assigned. |
| Plugin Name | The Plugin selected to run jobs for the event. |
| Event Target | The server group or individual server selected to run jobs for the event. |
| Job Source | The source of the job (who started it, the scheduler or manually by hand). |
| Server Hostname | The hostname of the server which is running the job. |
| Process ID | The ID of the process currently running the job. |
| Job Started | The date/time of when the job first started. |
| Elapsed Time | The current elapsed time of the job. |
| Remaining Time | The estimated remaining time (if available). |
The CPU donut chart visually indicates how close your job is to using a full CPU core. If it uses more than that (i.e. multiple threads or sub-processes), the chart simply shows "full" (solid color). The Memory donut visually indicates your job's memory vs. the "maximum" configured resource limit, or 1 GB if resource limits are not in effect for the job. The colors are green if the donut is under 50% filled, yellow if between 50% and 75%, and red if over 75%.
When the job completes, or when viewing details about a previously completed job, the display looks slightly different:
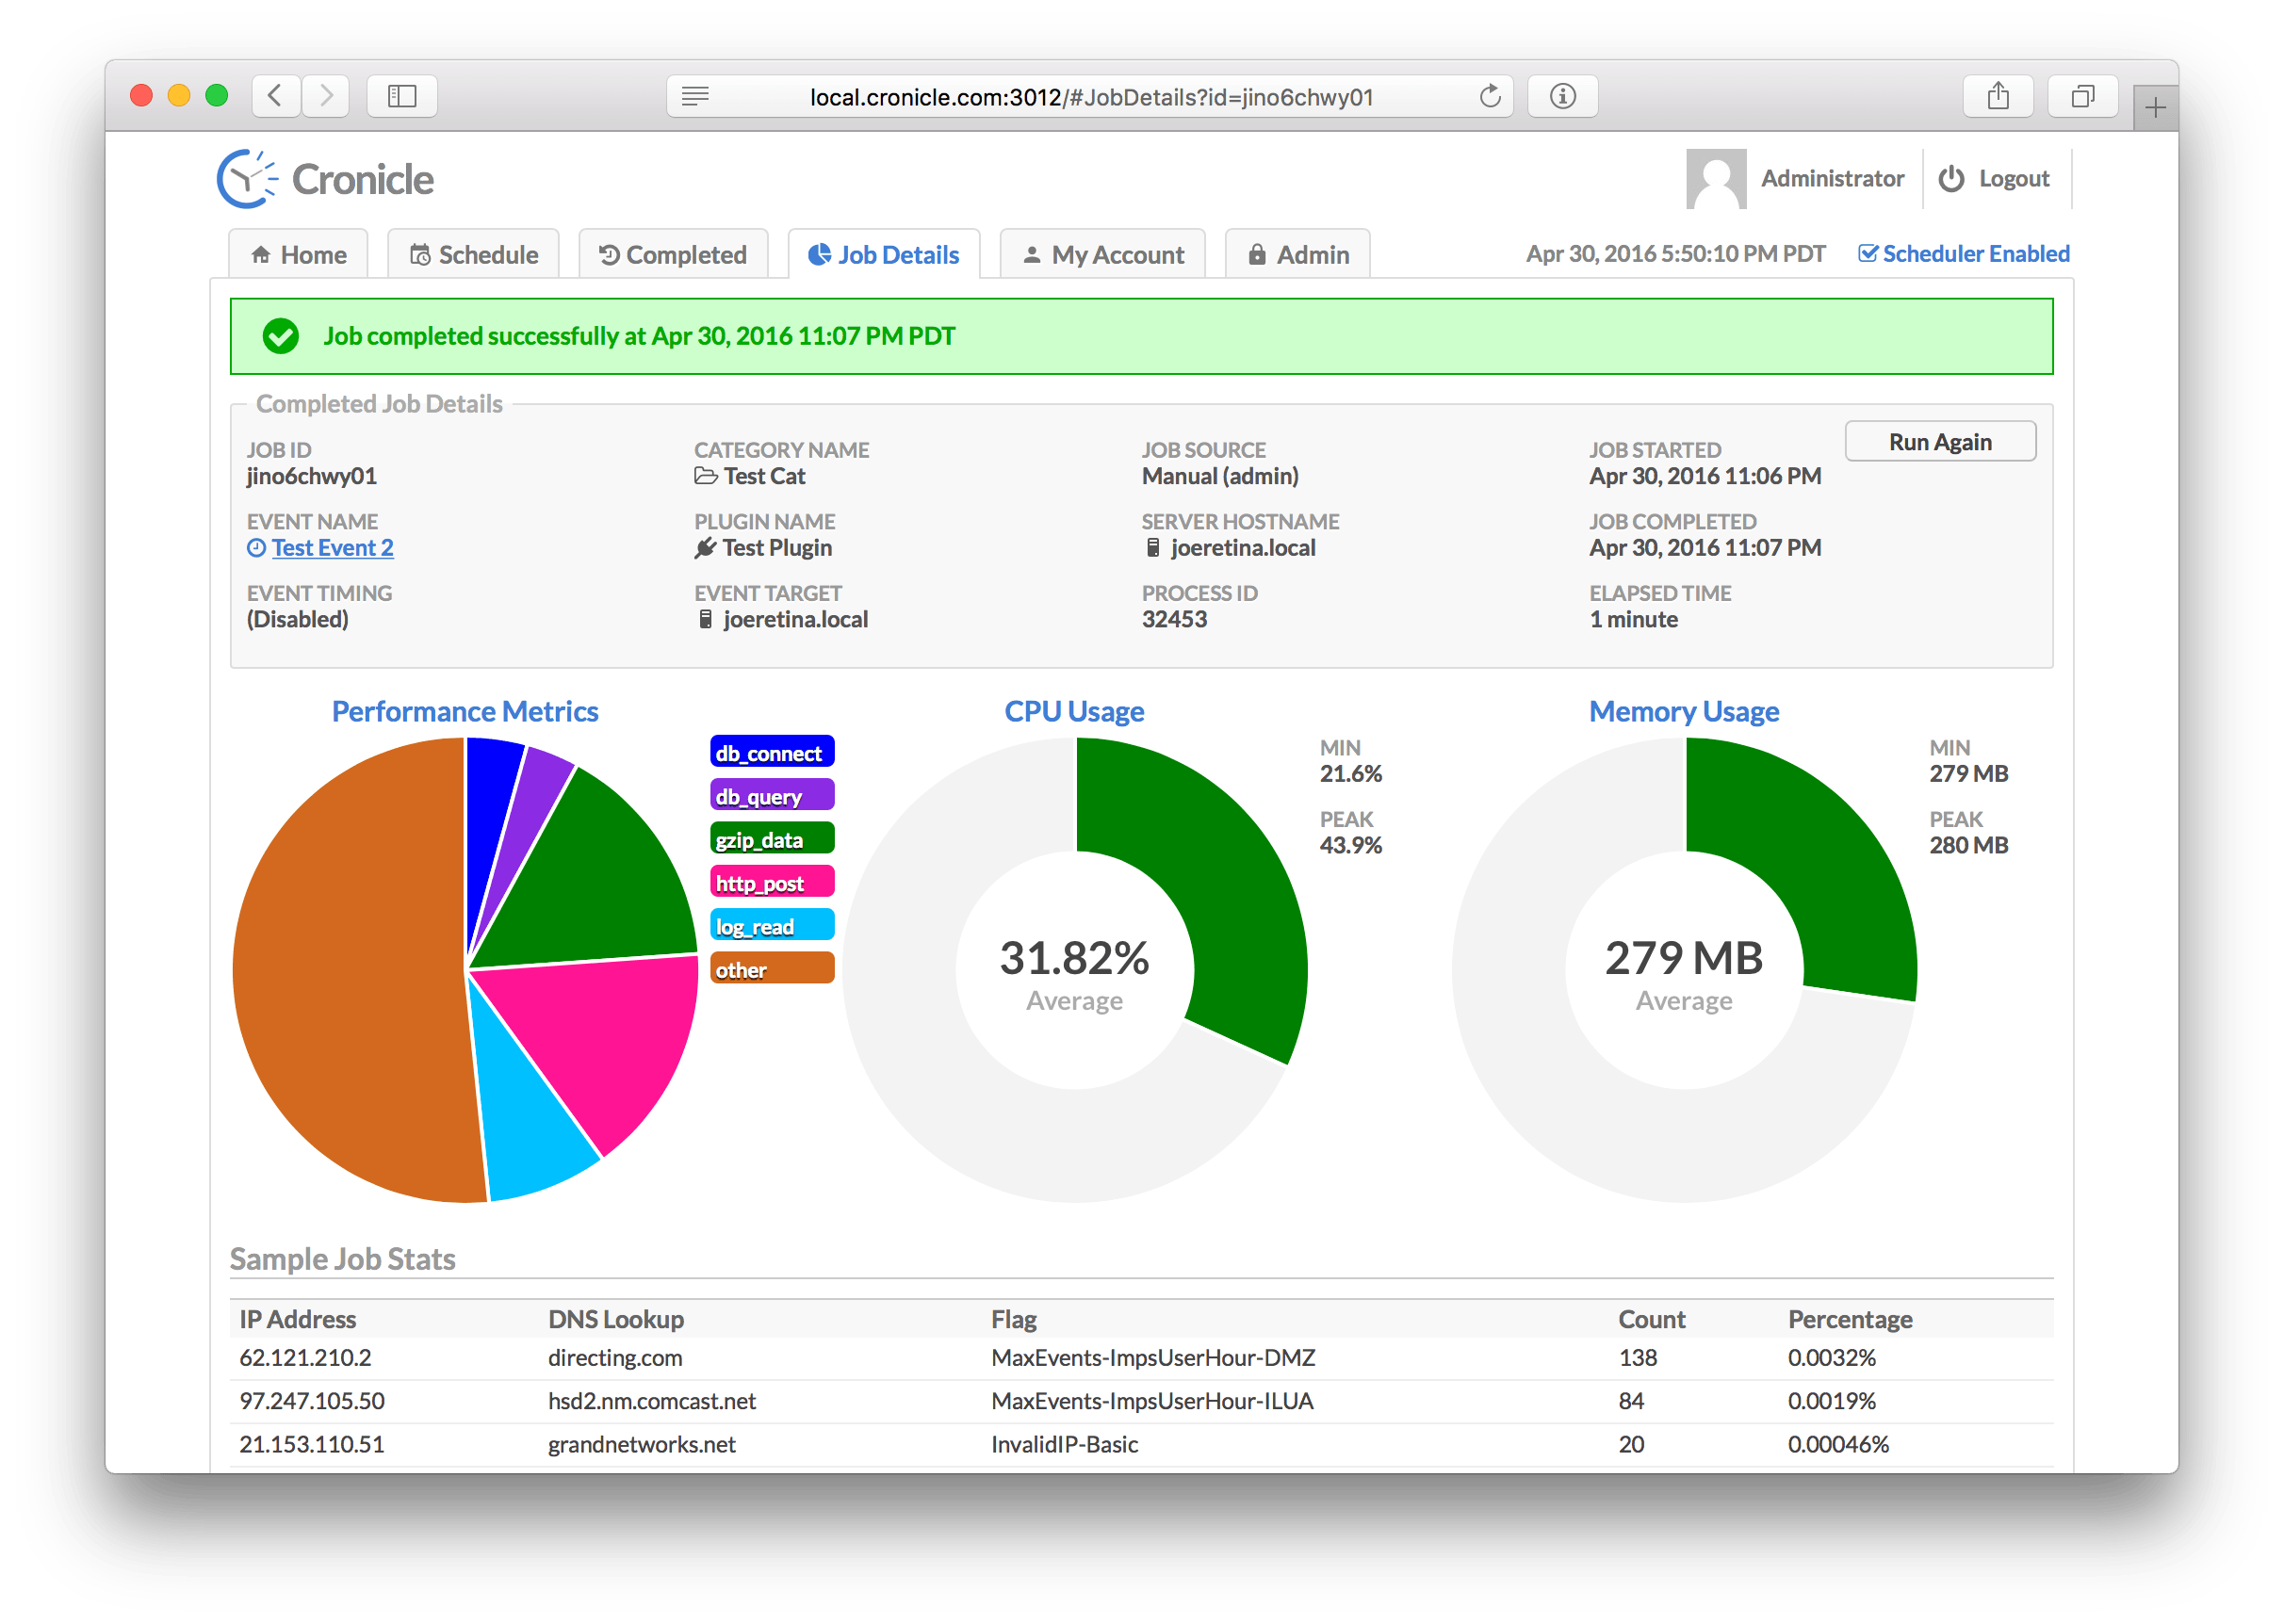
The only difference in the statistics table is that the right-hand column contains the Job Completed date/time instead of the remaining time. Below that, the left-hand donut graph now shows performance metrics from your Plugin (if provided). You can choose to provide performance metrics or not, and add as many custom categories as you like. For details, see the Writing Plugins and Performance Metrics sections below.
The CPU and Memory donut charts now show the average values over the course of your job run, rather than the "current" values while the job is still running. The same visual maximums and color rules apply (see above).
Here is how the Job Details tab looks when a job fails:
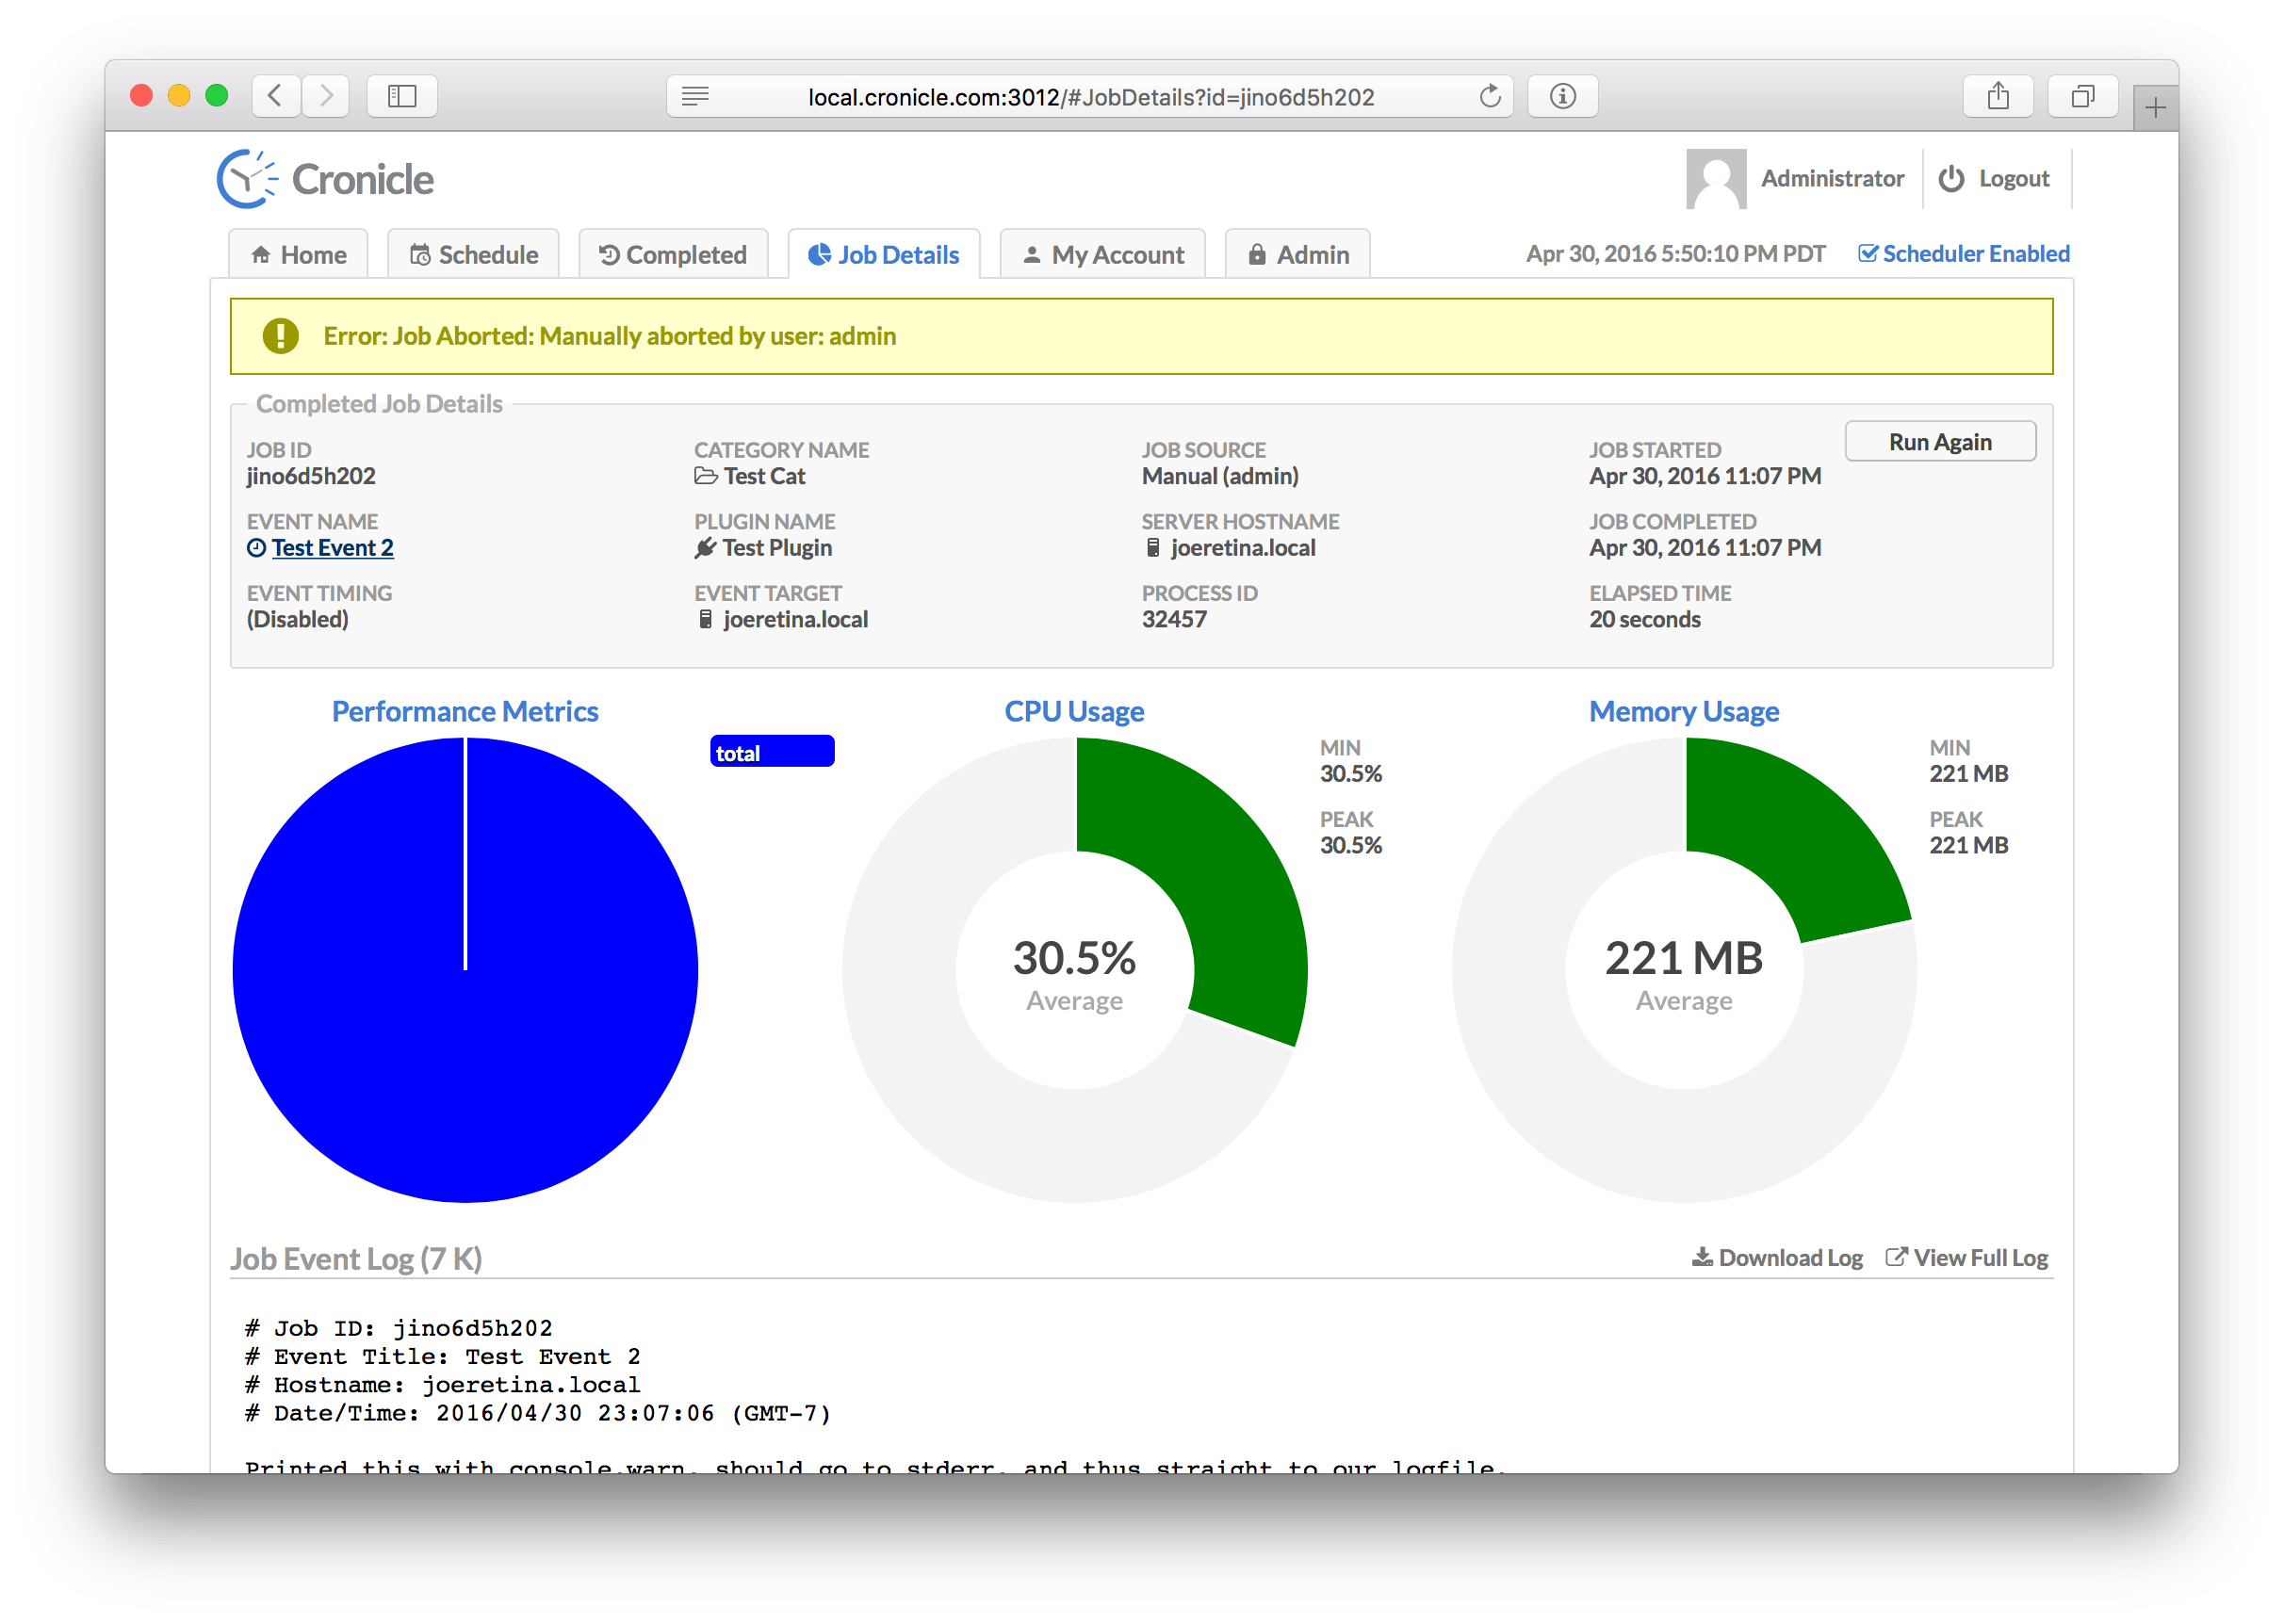
The error message is displayed in a banner along the top of the screen. The banner will be yellow if the job was aborted, or red if an error was returned from your Plugin.
In this case the job was aborted, so the Plugin had no chance to report performance metrics, hence the left-hand pie chart is blank.
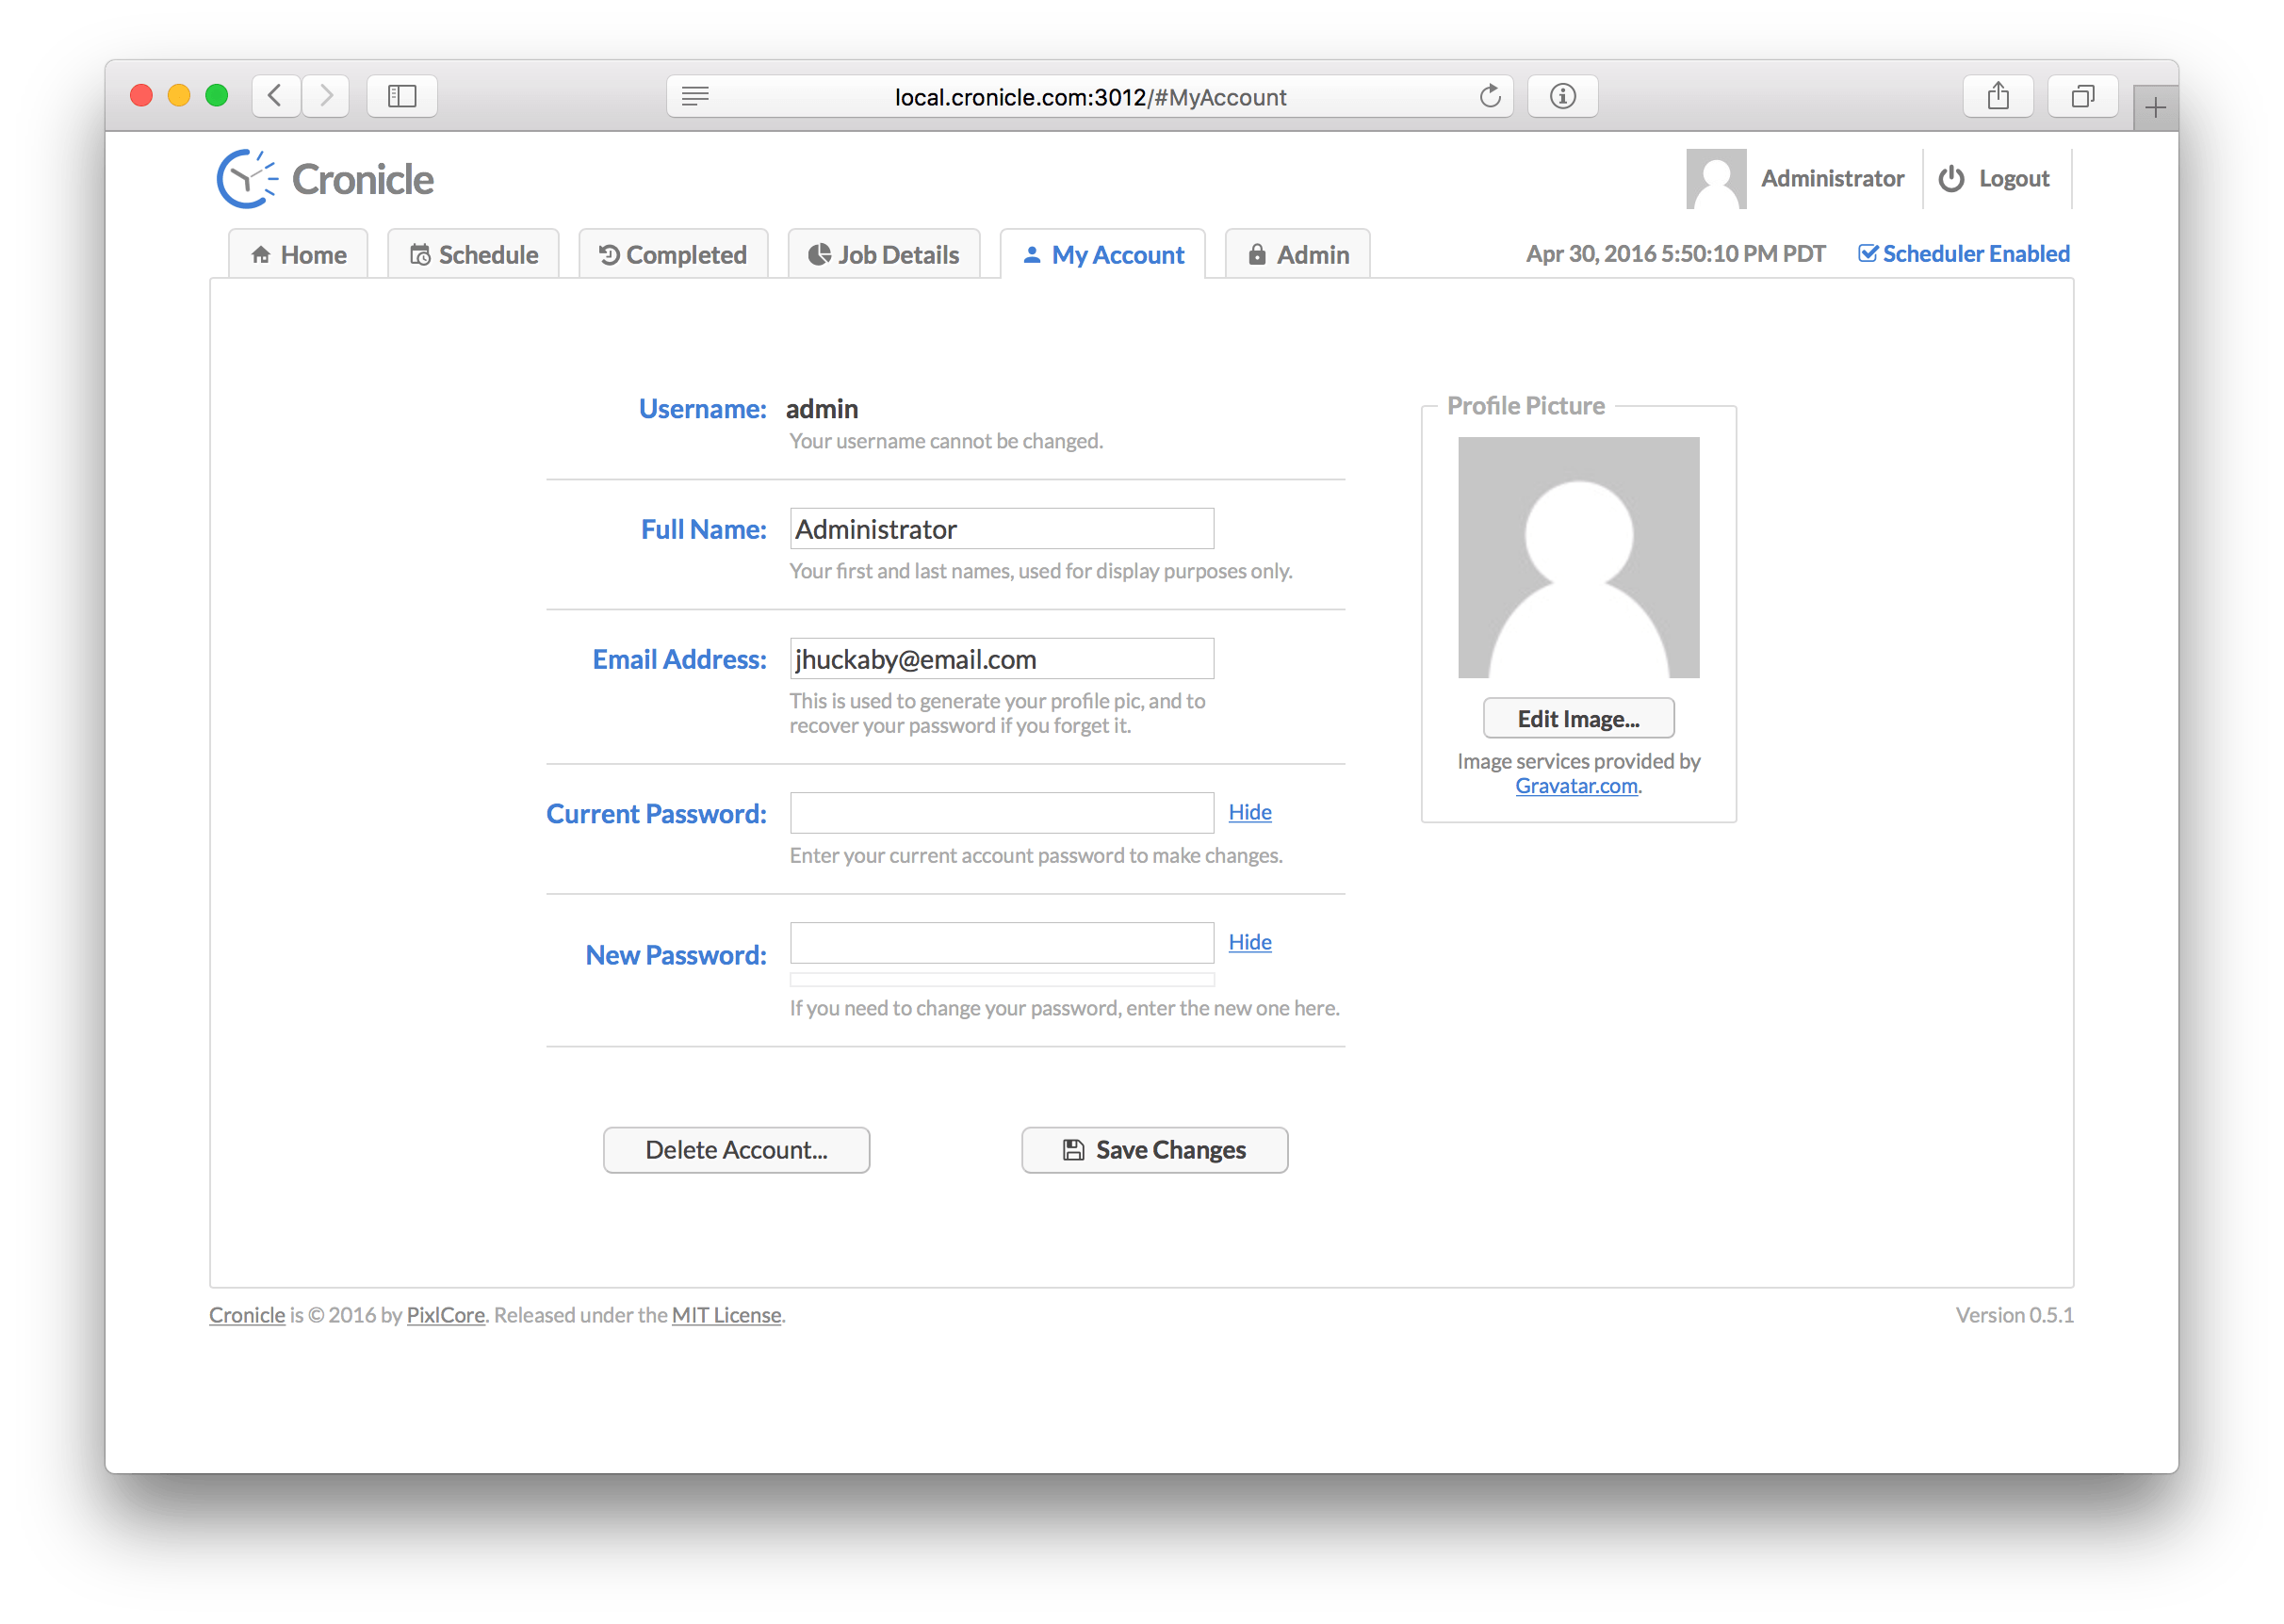
On this tab you can edit your own account profile, i.e. change your name, e-mail address, and/or password. You also have the option of completely deleting your account via the "Delete Account" button. For security purposes, in order to save any changes you must enter your existing account password.
Your user avatar image is automatically pulled from the free Gravatar.com service, using your e-mail address. To customize your image, please login or create a Gravatar account using the same e-mail address as the one in your Cronicle account.
This tab is only visible and accessible to administrator level users. It allows you to view the global activity log, manage API keys, categories, Plugins, servers and users. To access all the various functions, use the tabs along the left side of the page.
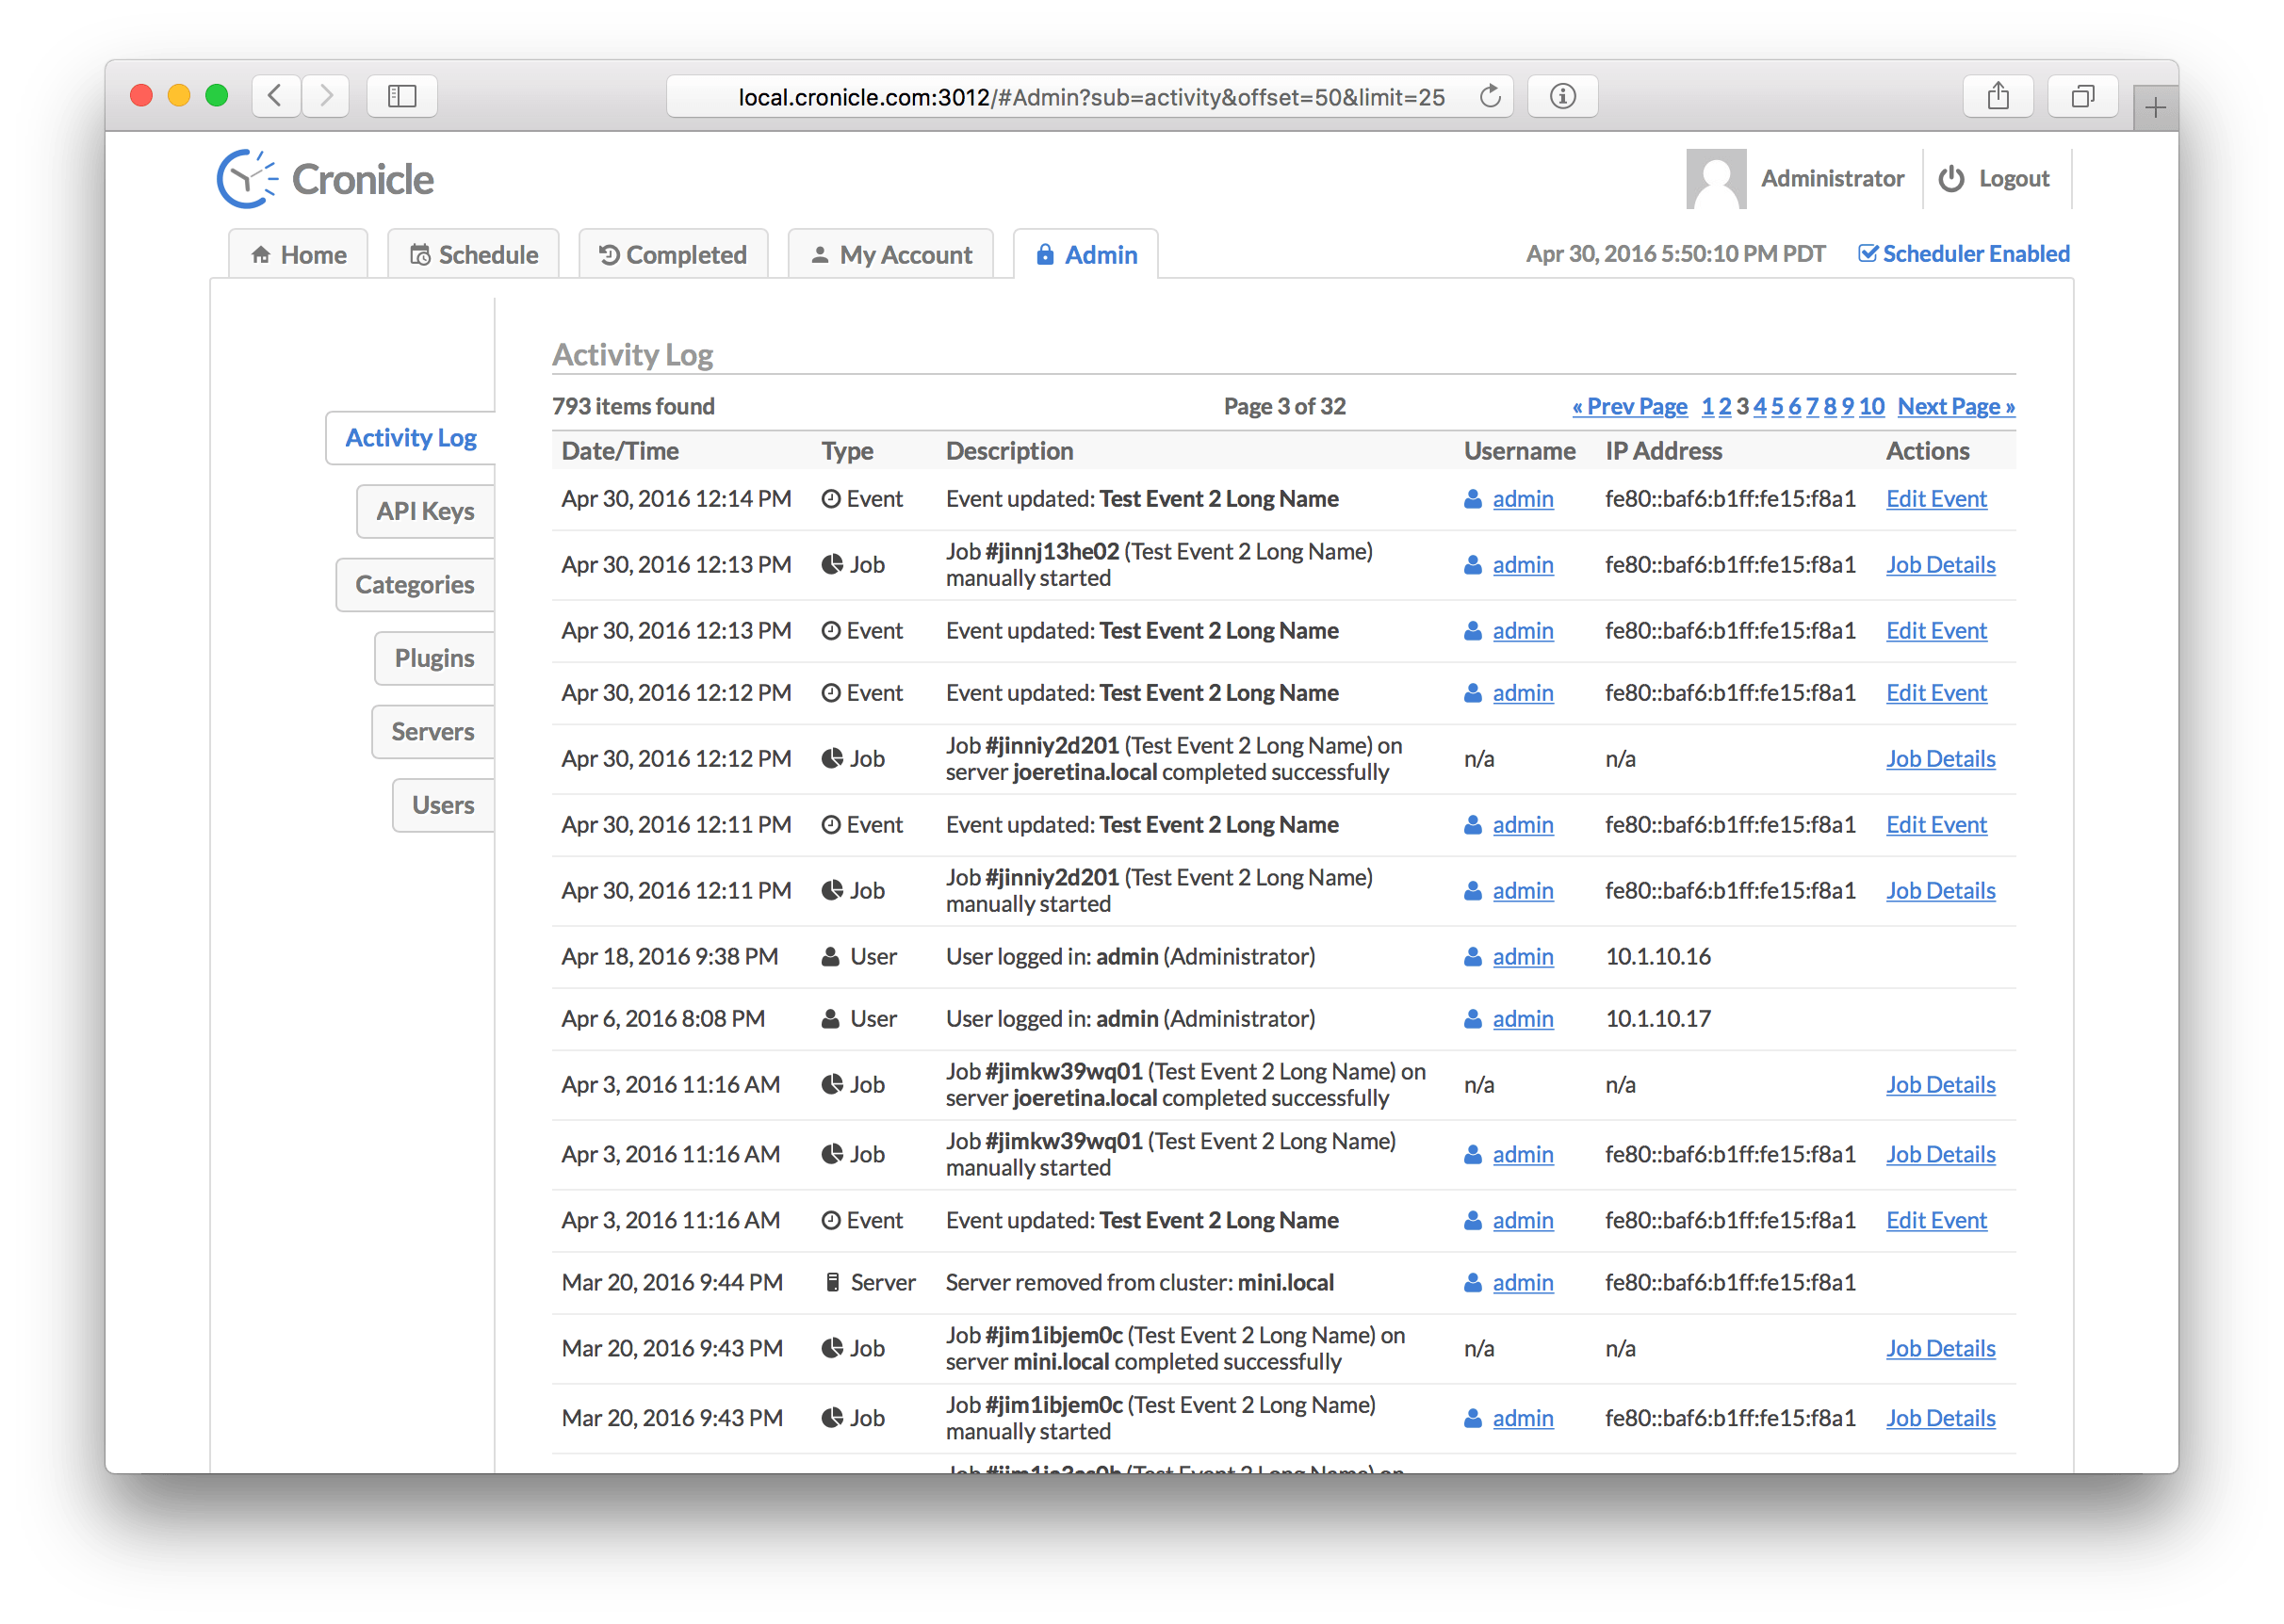
All activity in Cronicle is logged, and viewable on the Activity Log tab. The log is presented as a paginated table, sorted by descending date/time (newest activity at the top). Pagination controls are located in the top-right corner. The table columns are as follows:
| Column | Description |
|---|---|
| Date/Time | The date and time of the activity (adjusted for your local timezone). |
| Type | The type of activity (error, event, category, server, etc.). |
| Description | A description of the activity (varies based on the type). |
| Username | The username or API Key associated with the activity, if applicable. |
| IP Address | The IP address associated with the activity, if applicable. |
| Actions | A set of actions to take on the activity (usually links to more info). |
There are several different types of activity that can appear in the activity log:
| Activity Type | Description |
|---|---|
| Error | Error messages, such as failing to send e-mail or server clocks out of sync. |
| Warning | Warning messages, such as a failure to launch a scheduled event. |
| API Key | API Key related activity, such as a user creating, modifying or deleting keys. |
| Category | Category related activity, such as a user creating, modifying or deleting categories. |
| Event | Event related activity, such as a user creating, modifying or deleting events. |
| Group | Server Group related activity, such as a user creating, modifying or deleting groups. |
| Job | Job related activity, including every job completion (success or fail). |
| Plugin | Plugin related activity, such as a user creating, modifying or deleting Plugins. |
| Server | Multi-Server related activity, such as servers being added or removed from the cluster. |
| Scheduler | Scheduler related activity, such as the scheduler being enabled or disabled. |
| User | User related activity, such as a user being created, modified or deleted. |
Cronicle will keep the latest list_row_max activity log entries in storage (the default is 10,000).
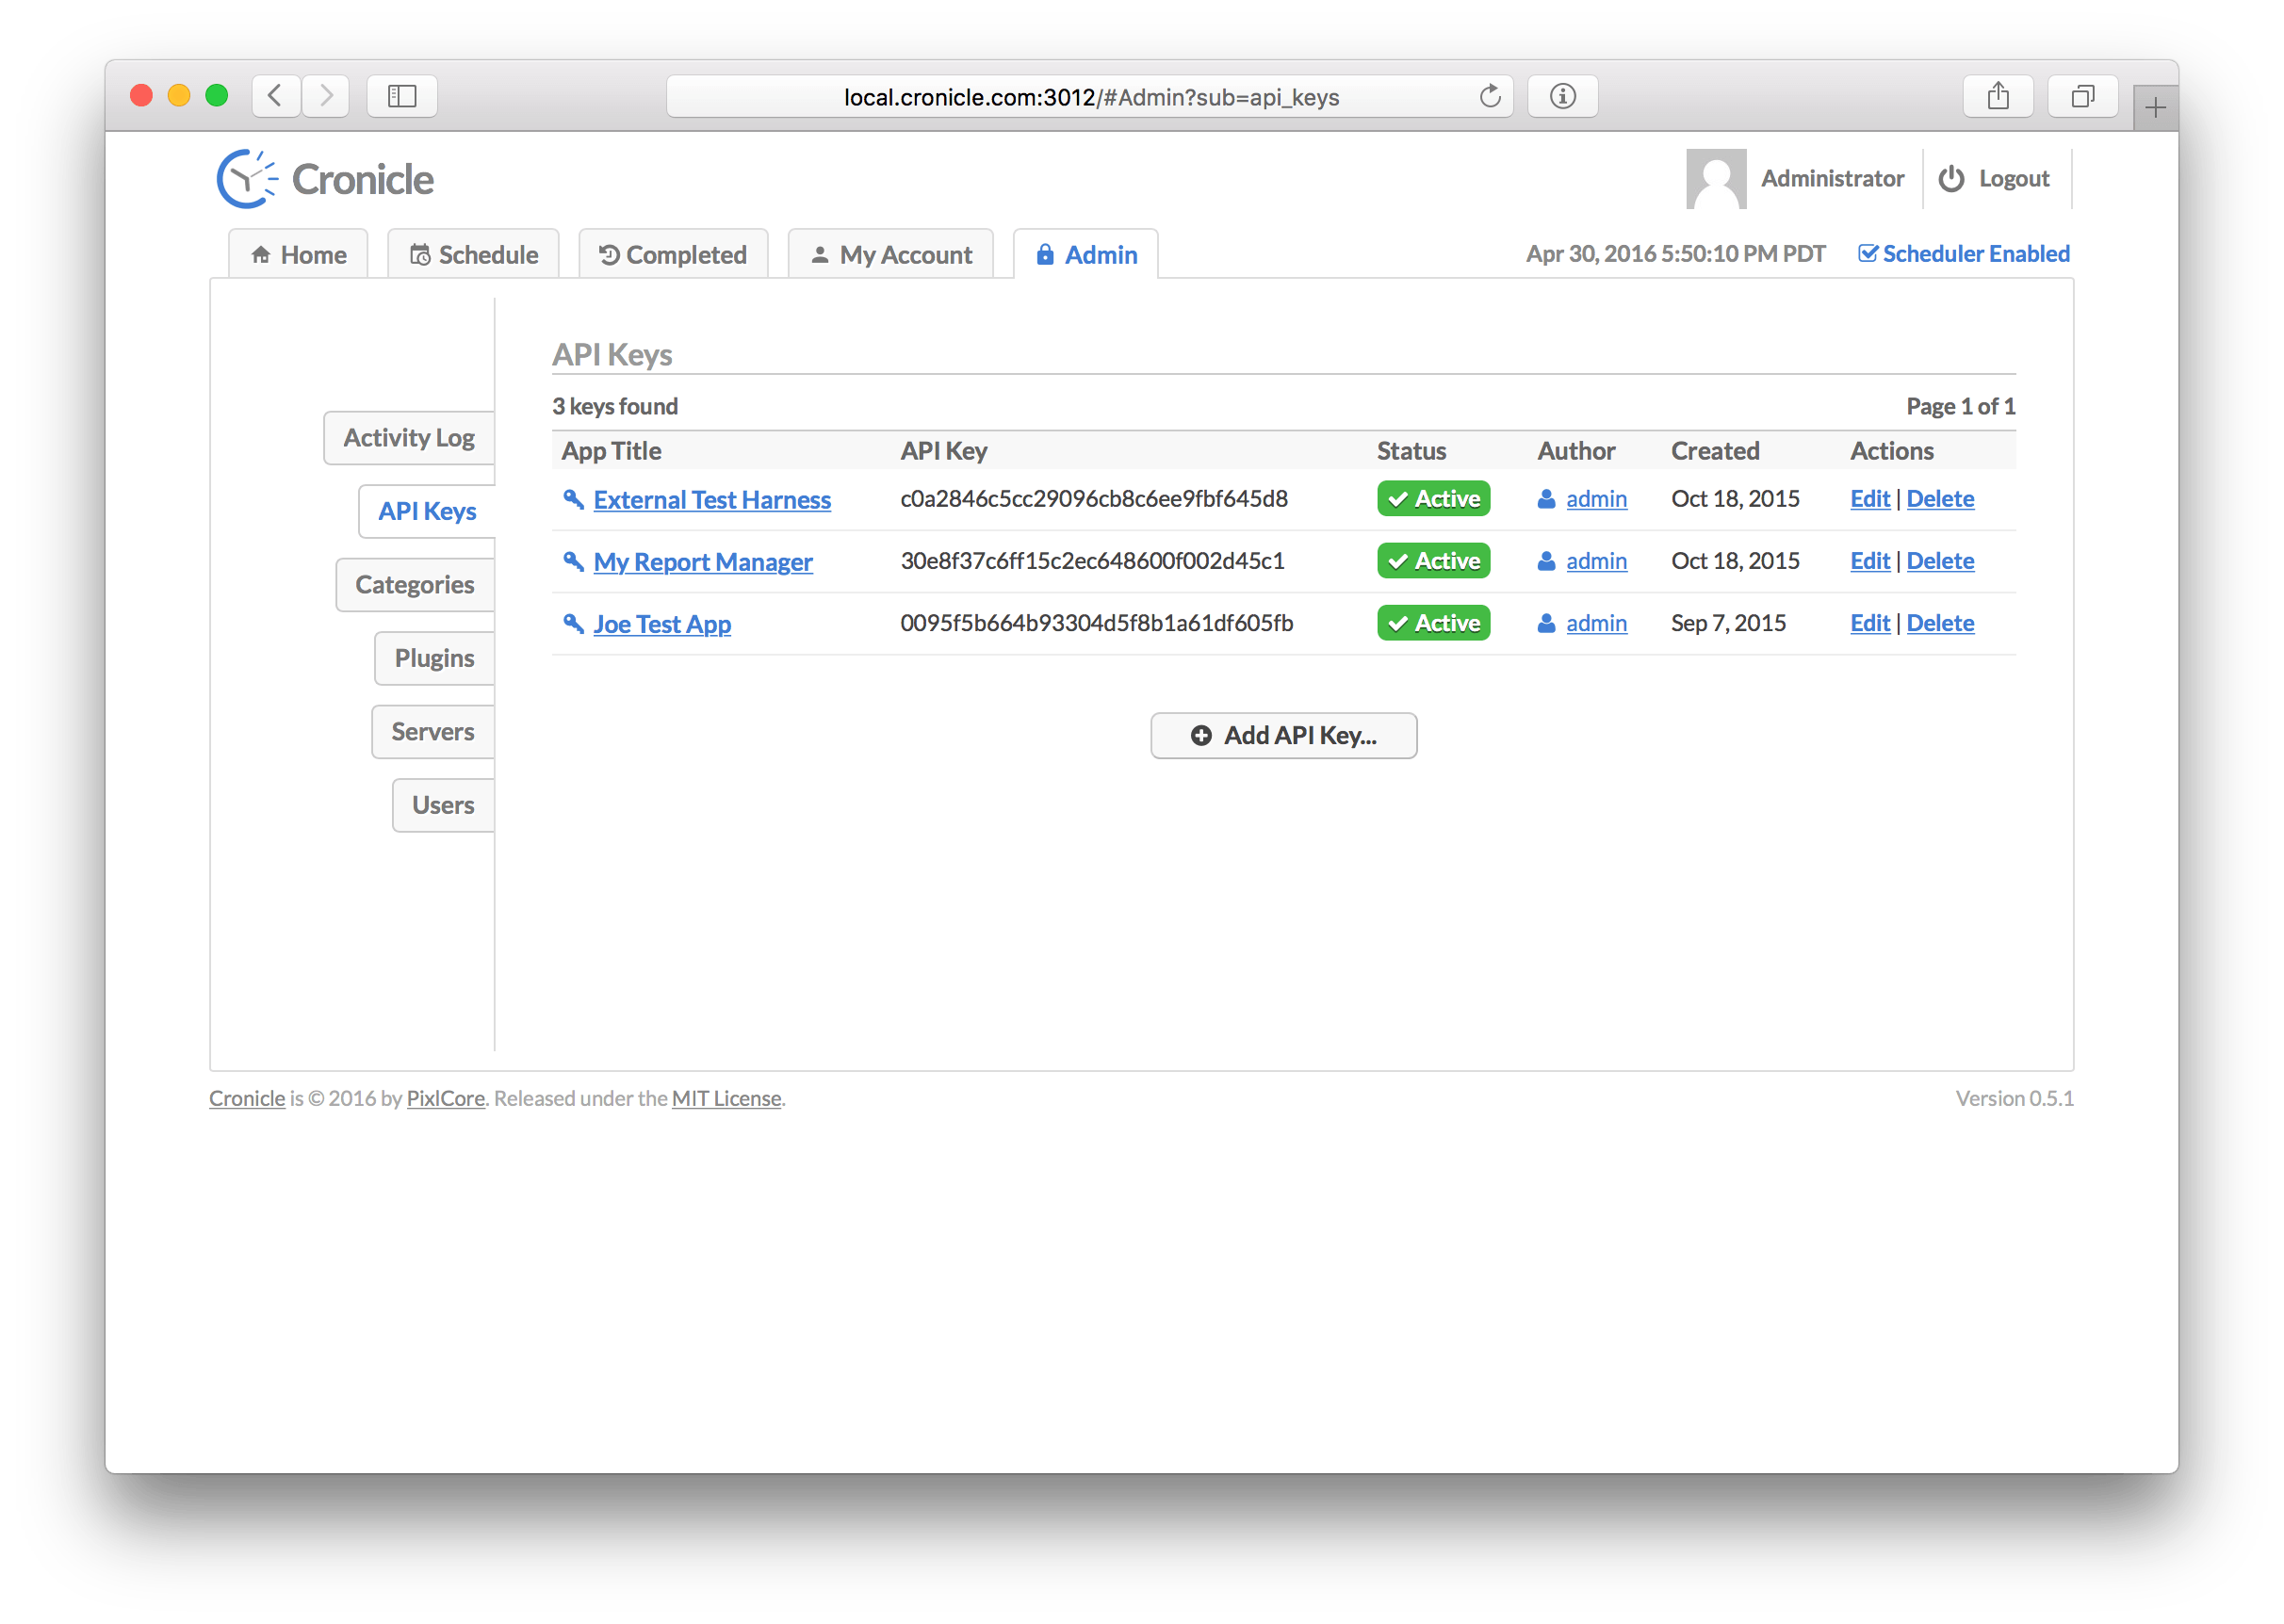
API Keys allow you to register external applications or services to use the REST API. This tab lists all the API Keys registered in the system, and allows you to edit, delete and add new keys. The table columns include:
| Column | Description |
|---|---|
| App Title | The application title associated with the key. |
| API Key | The API Key itself, which is a 32-character hexadecimal string. |
| Status | The status of the key, which can be active or disabled. |
| Author | The username who originally created the key. |
| Created | The date when the key was created. |
| Actions | A list of actions to take (edit and delete). |
When you create or edit a key, you will see this screen:
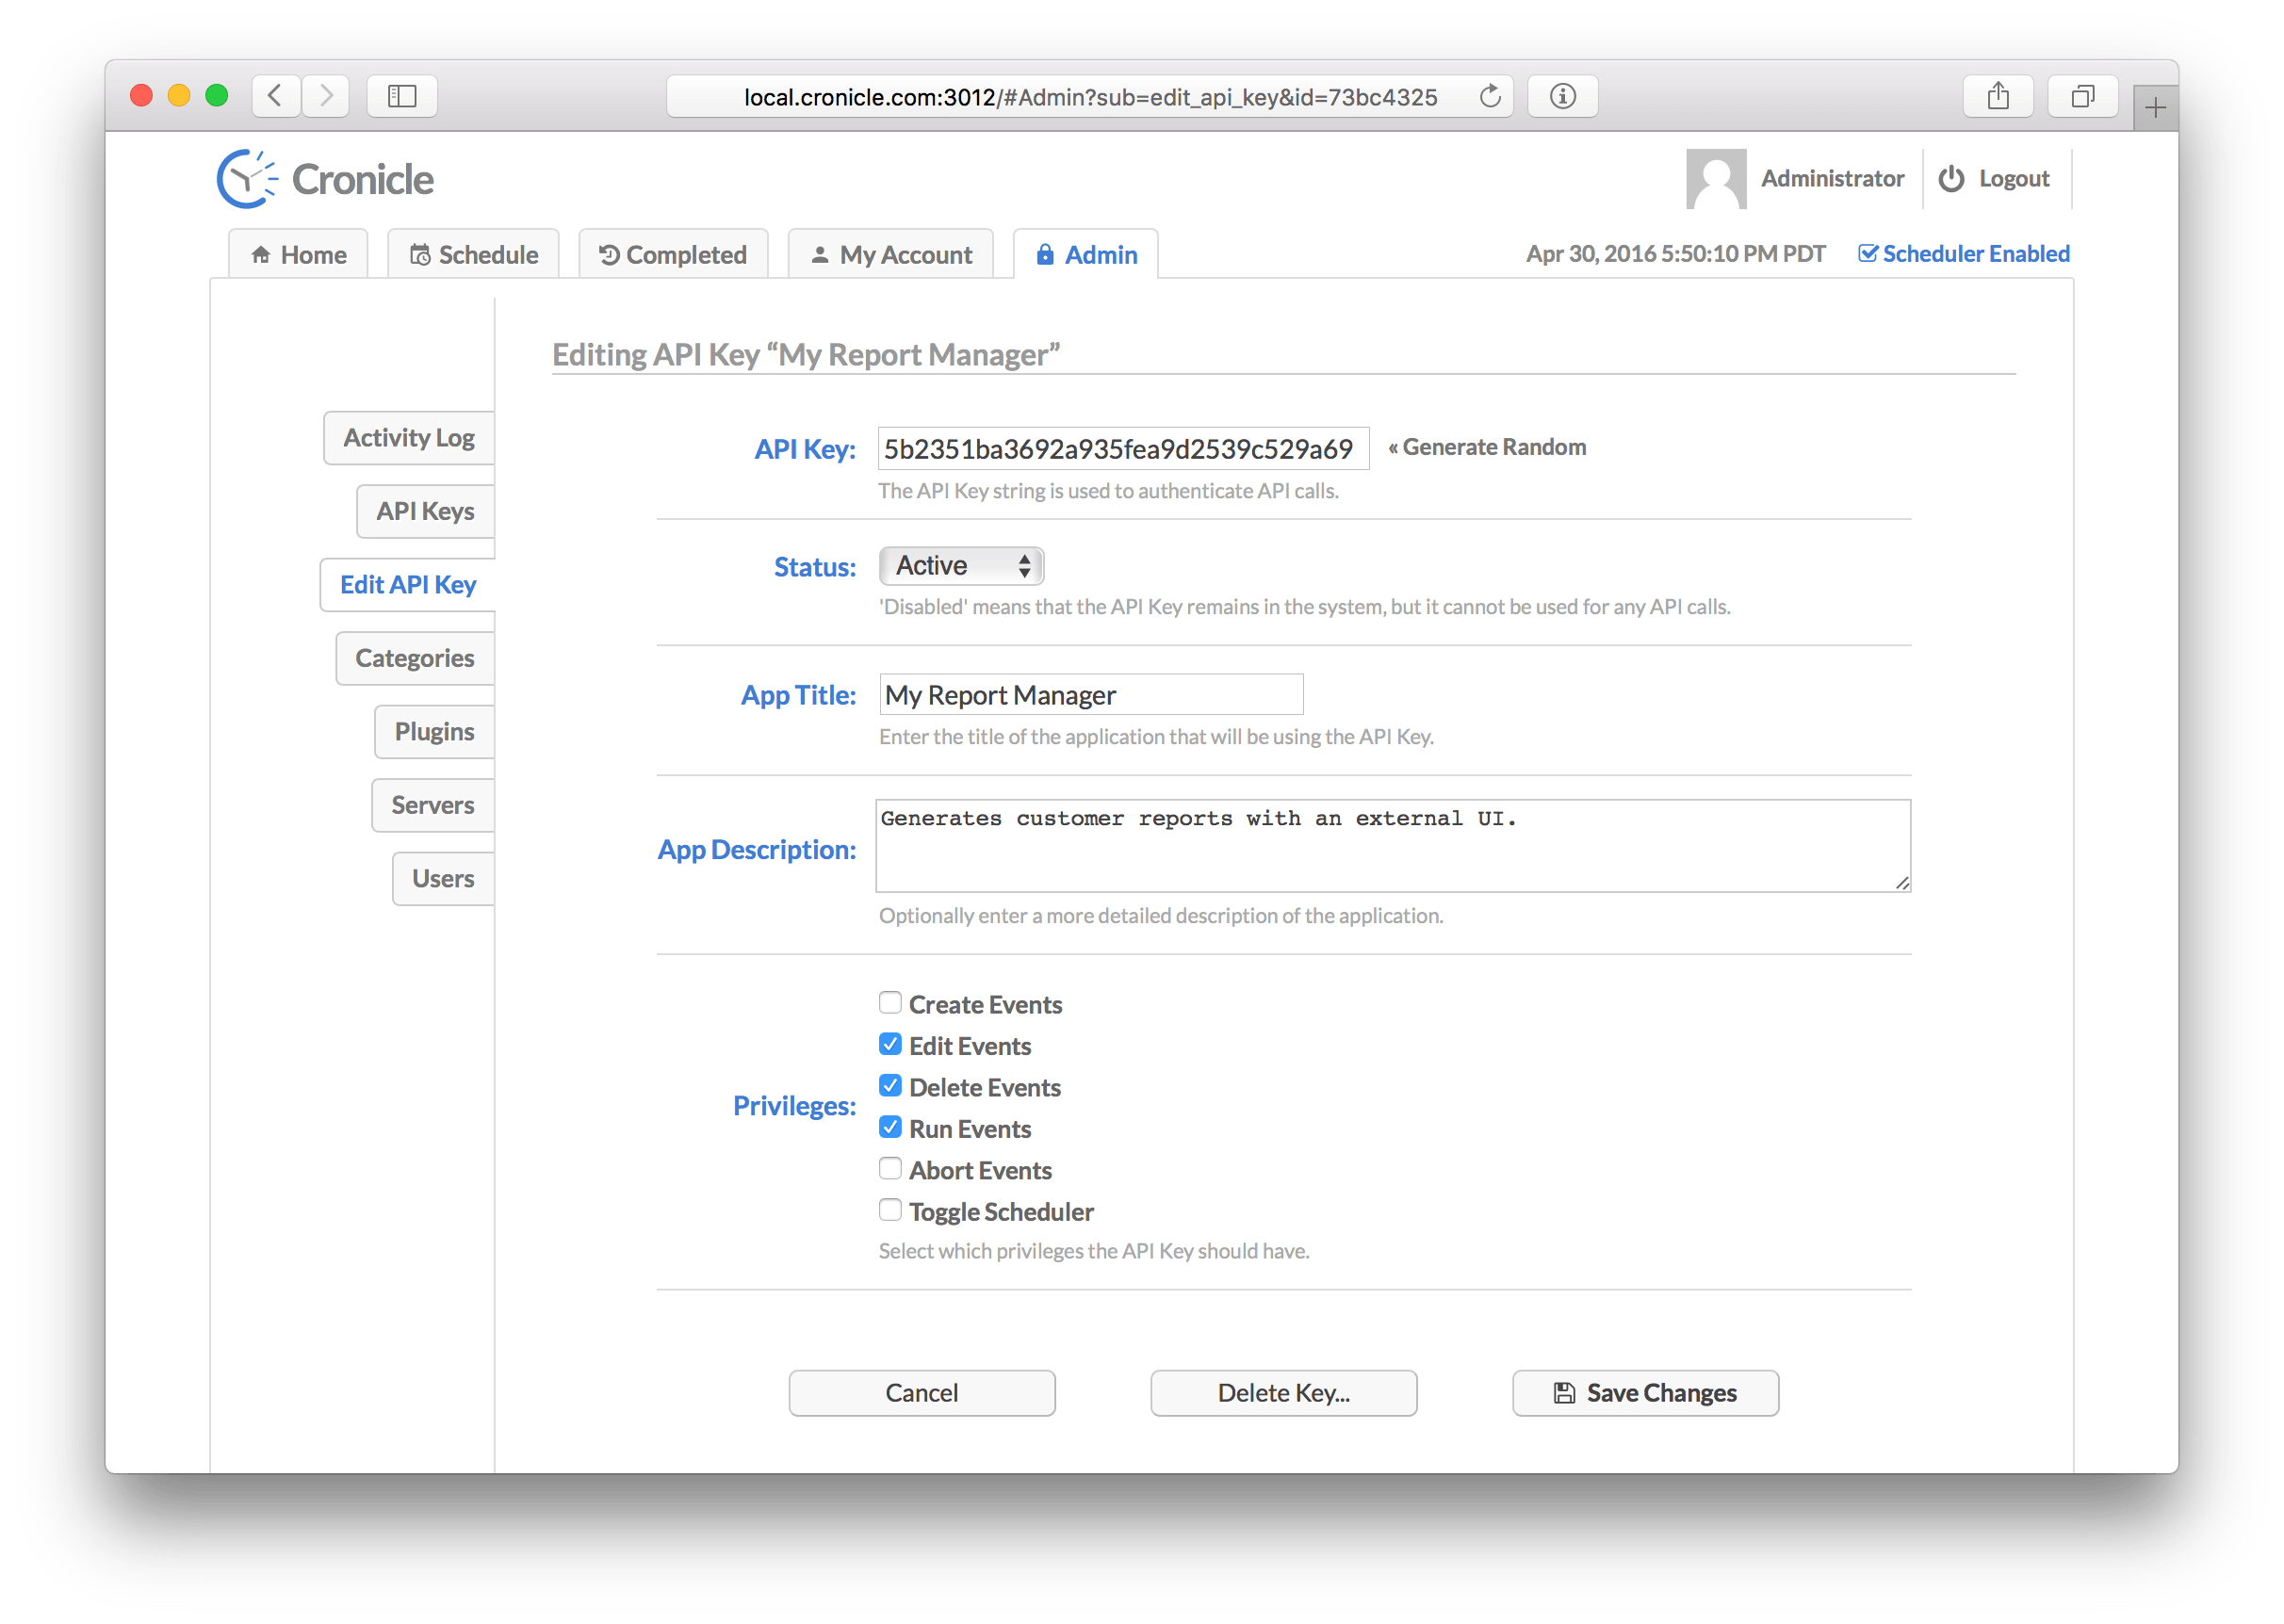
The API Key form contains the following elements:
- The API Key itself, which is an automatically generated 32-character hexadecimal string. You can manually customize this if desired, or click Generate Random to generate a new random key.
- The Status which is either
ActiveorDisabled. Disable an API Key if you have a misbehaving app or an exposed key, and all API calls will be rejected. Only active keys are allowed to make any calls. - The App Title which is the name of your app that will be using the key. This is displayed in various places including the activity log.
- An App Description which is an optional verbose description of your app, just so other users can understand what the purpose of each API key is.
- A set of Privileges, which grant the API Key access to specific features of Cronicle. This is the same system used to grant user level permissions.
For more details on how to use the API Key system in your apps, see the API Keys section below.
Events can be assigned to custom categories that you define. This is a great way to enable/disable groups of events at once, set a maximum concurrent job limit for the entire category, set default notification and resource limits, and highlight events with a specific color.
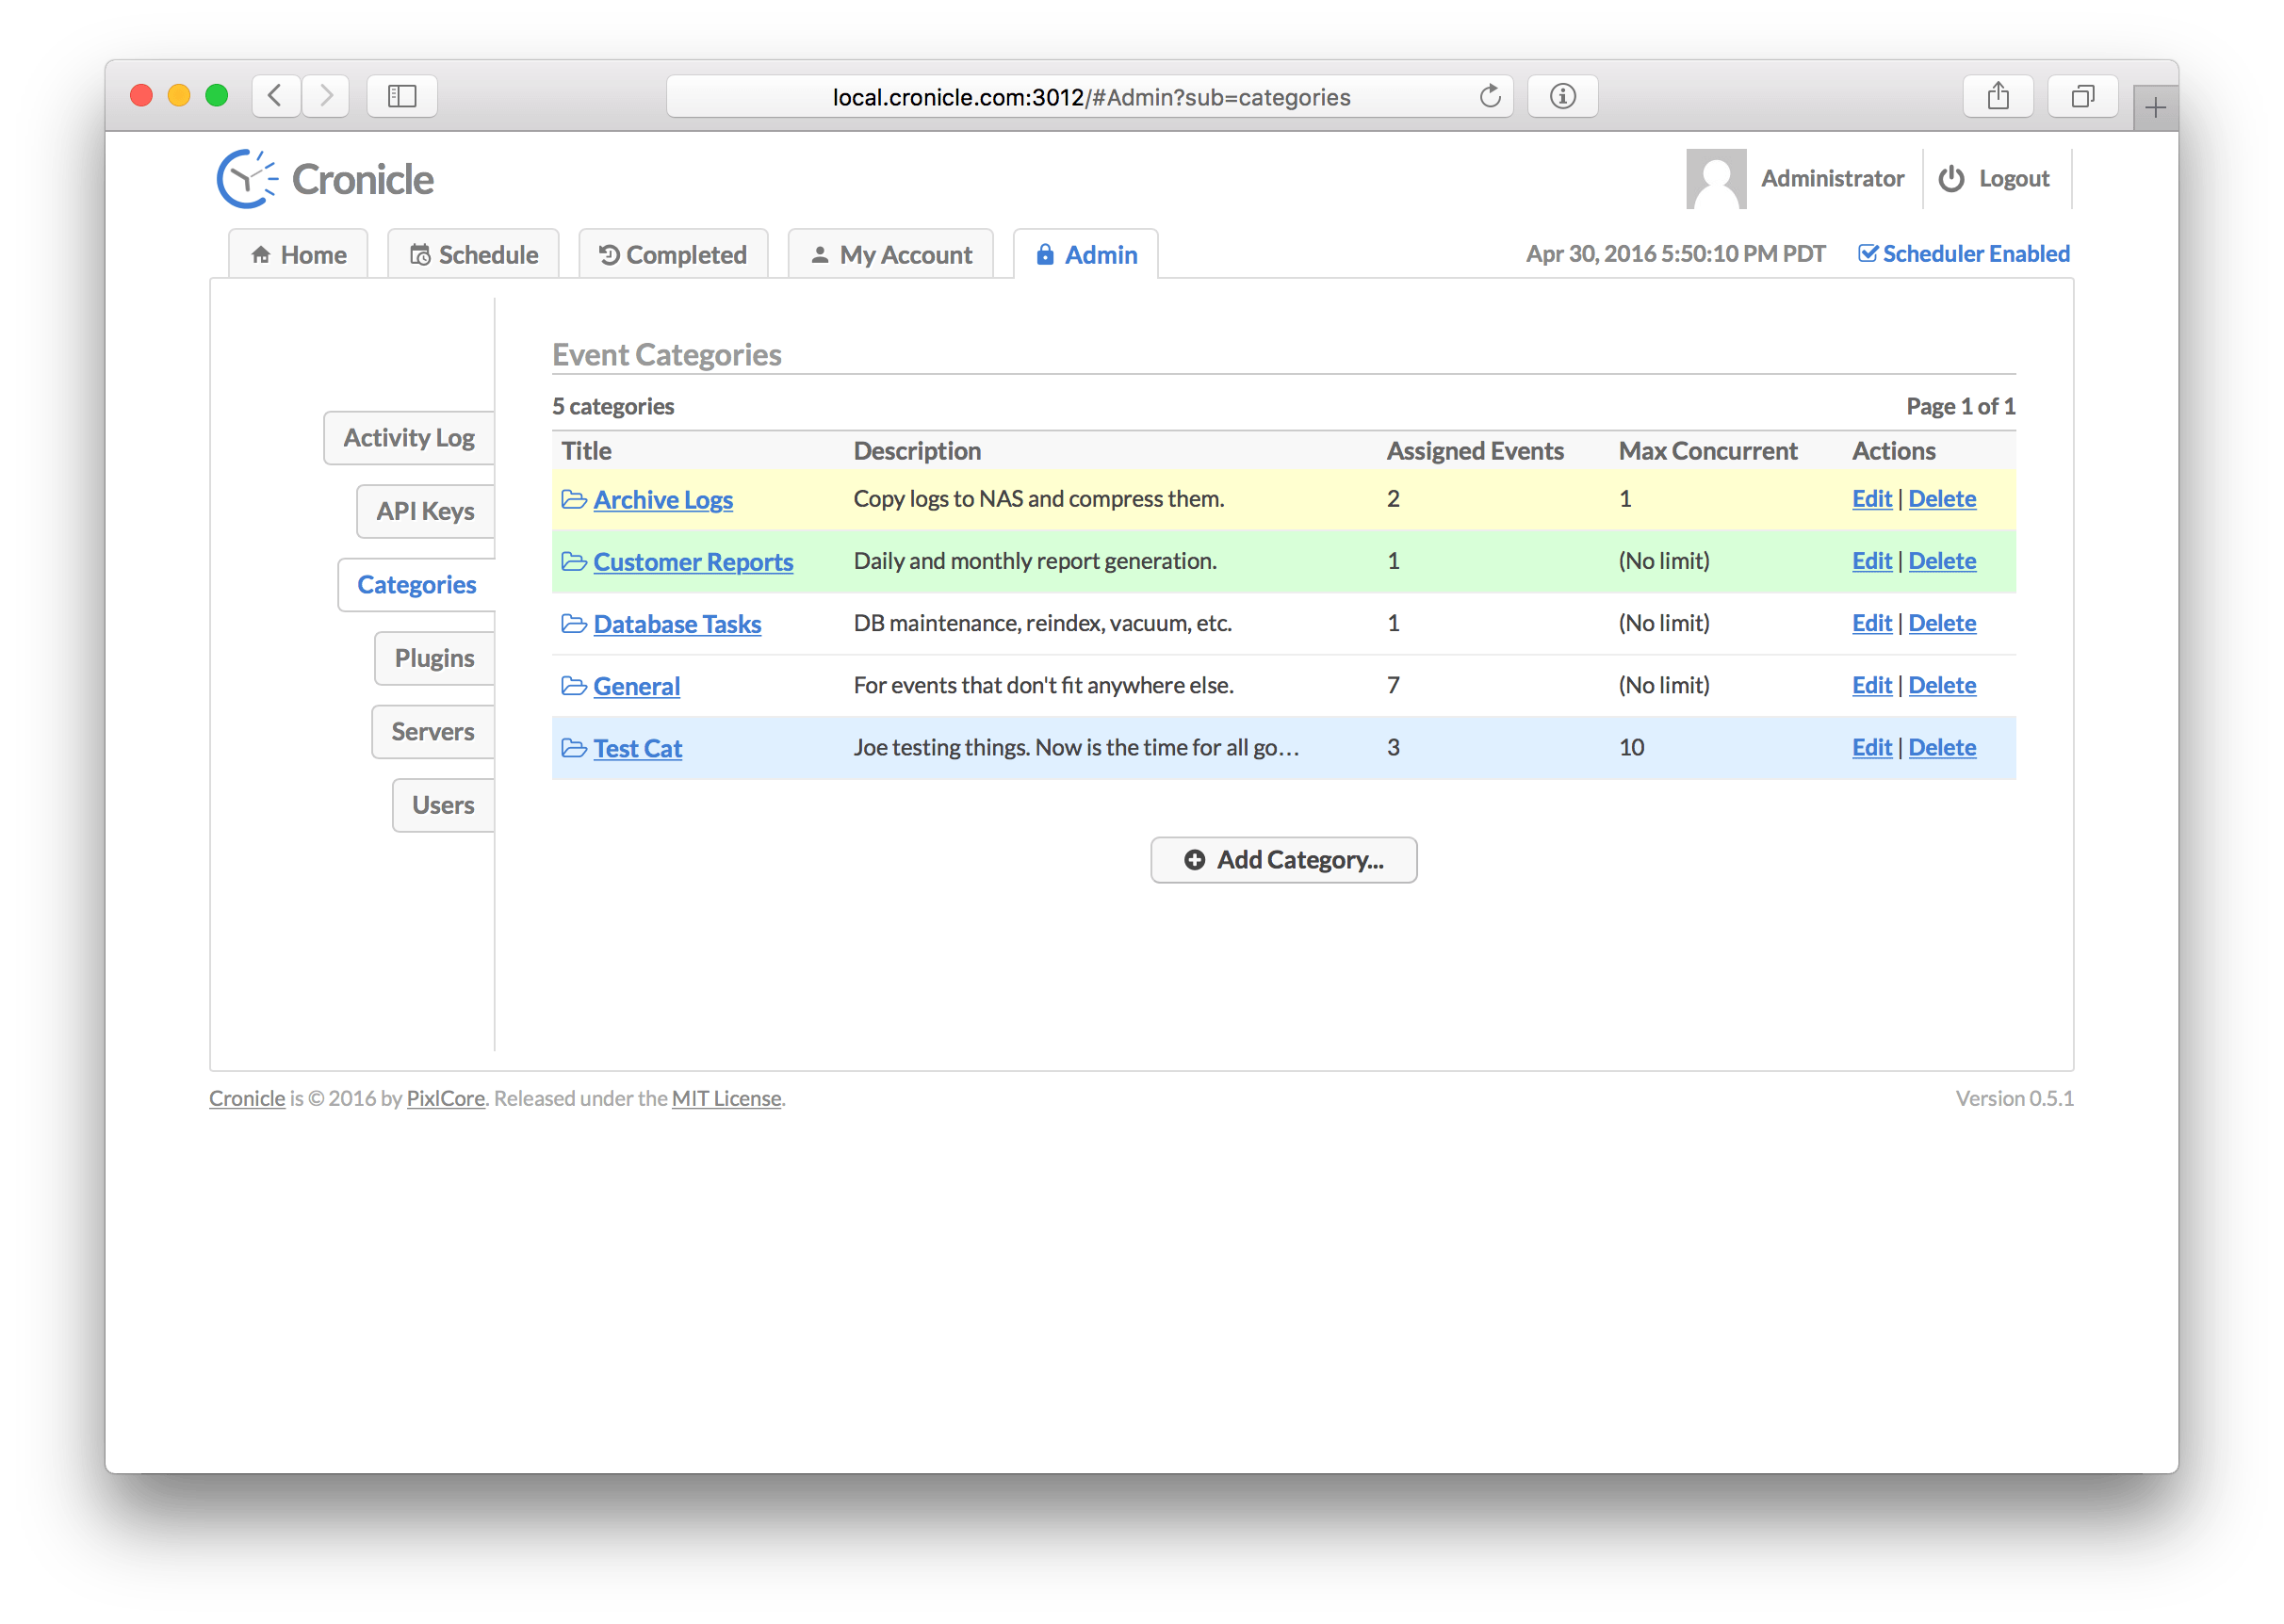
On this screen is the list of all event categories. The table columns are as follows:
| Column | Description |
|---|---|
| Title | The title of the category, used for display purposes. |
| Description | An optional description of the category. |
| Assigned Events | The number of events assigned to the category. |
| Max Concurrent | The maximum number of concurrent jobs to allow. |
| Actions | A list of actions to take (edit and delete). |
When you create or edit a category, you are taken to this screen:
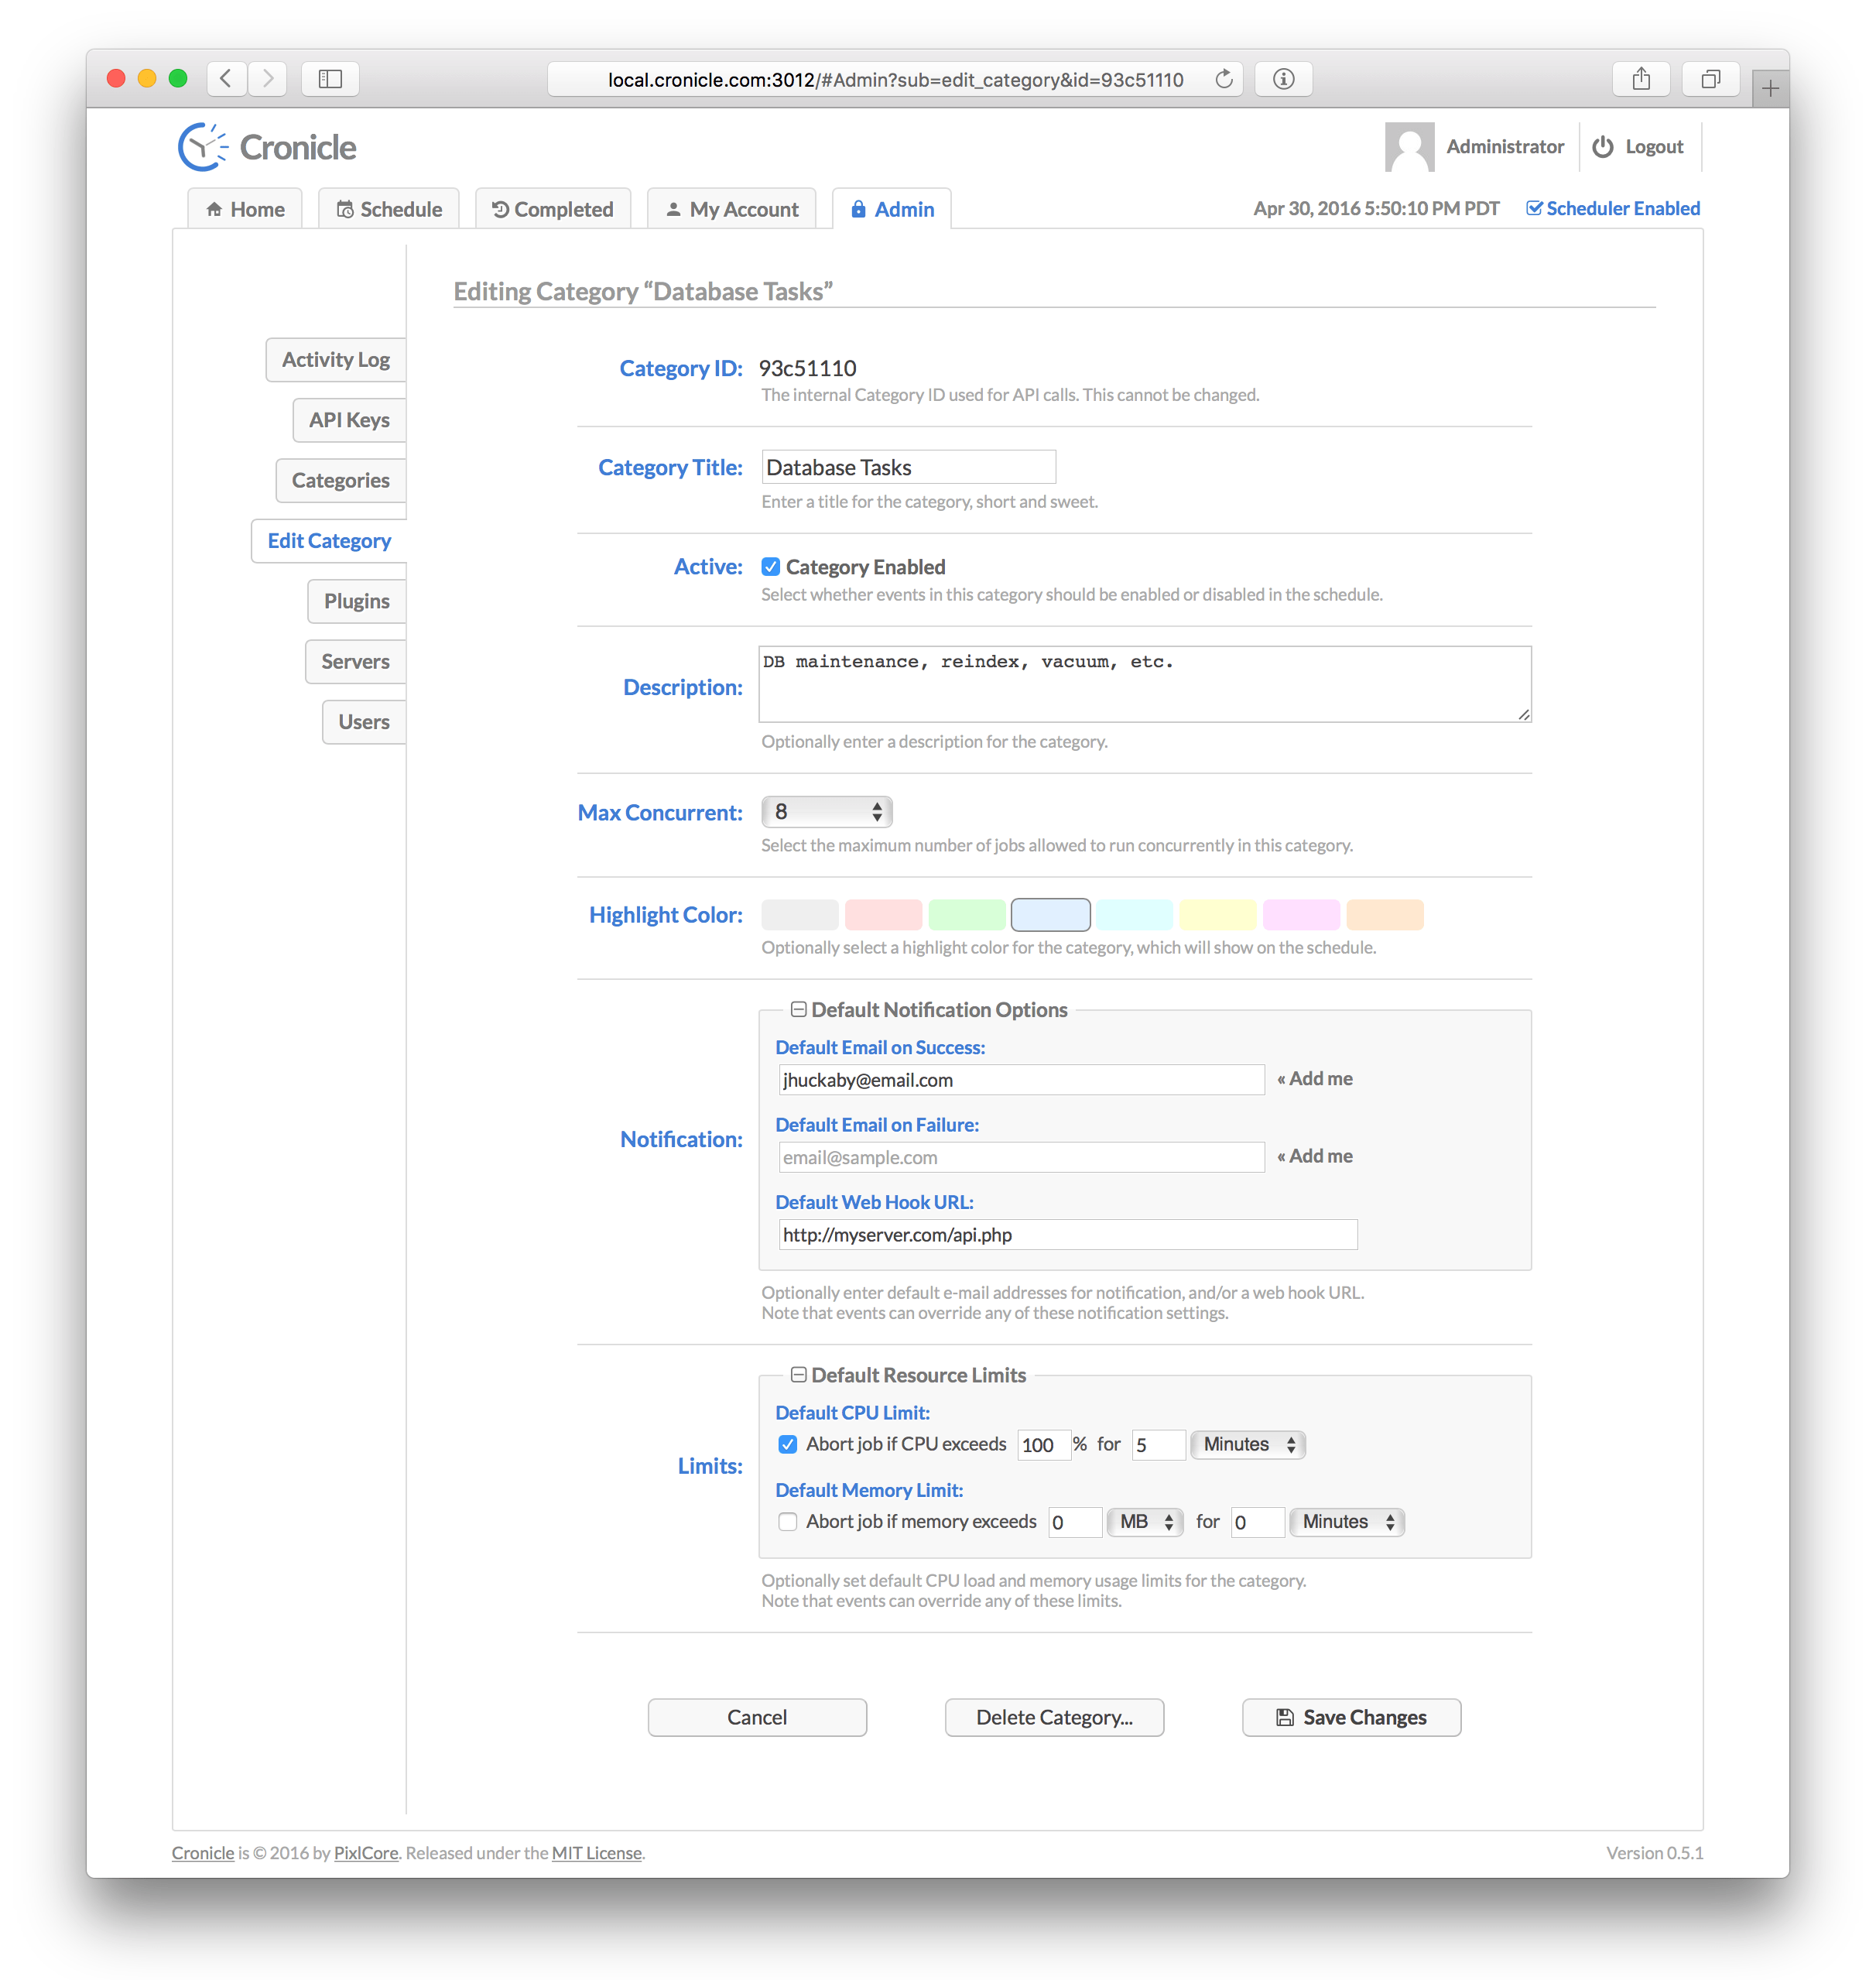
The category edit form contains the following elements:
- The Category ID which is an auto-generated alphanumeric ID used only by the API. This cannot be changed.
- The Category Title which is used for display purposes.
- The Status which controls whether the category is active or disabled. This also affects all events assigned to the category, meaning if the category is disabled, all the events assigned to it will also be effectively disabled as well (the scheduler won't start jobs for them).
- An optional Description of the category, for your own use.
- A Max Concurrent selector, which allows you to set the maximum allowed jobs to run concurrently across all events in the category. This is not a default setting that is applied per event, but rather a total overall limit for all assigned events.
- An optional Highlight Color which is displayed as the background color on the main Schedule Tab for all events assigned to the category.
- A set of Default Notification Options, which include separate e-mail lists for successful and failed jobs, and a default Web Hook URL. These settings may be overridden per each event.
- A set of Default Resource Limits, which include separate CPU and Memory limits. Note that these are measured per job, and not as a category total. These settings may be overridden per each event (see Event Resource Limits for more details).
Plugins are used to run jobs, and can be written in virtually any language. They are spawned as sub-processes, launched via a custom command-line script that you provide. Communication is achieved via reading and writing JSON to STDIN / STDOUT. For more details, see the Plugins section below.
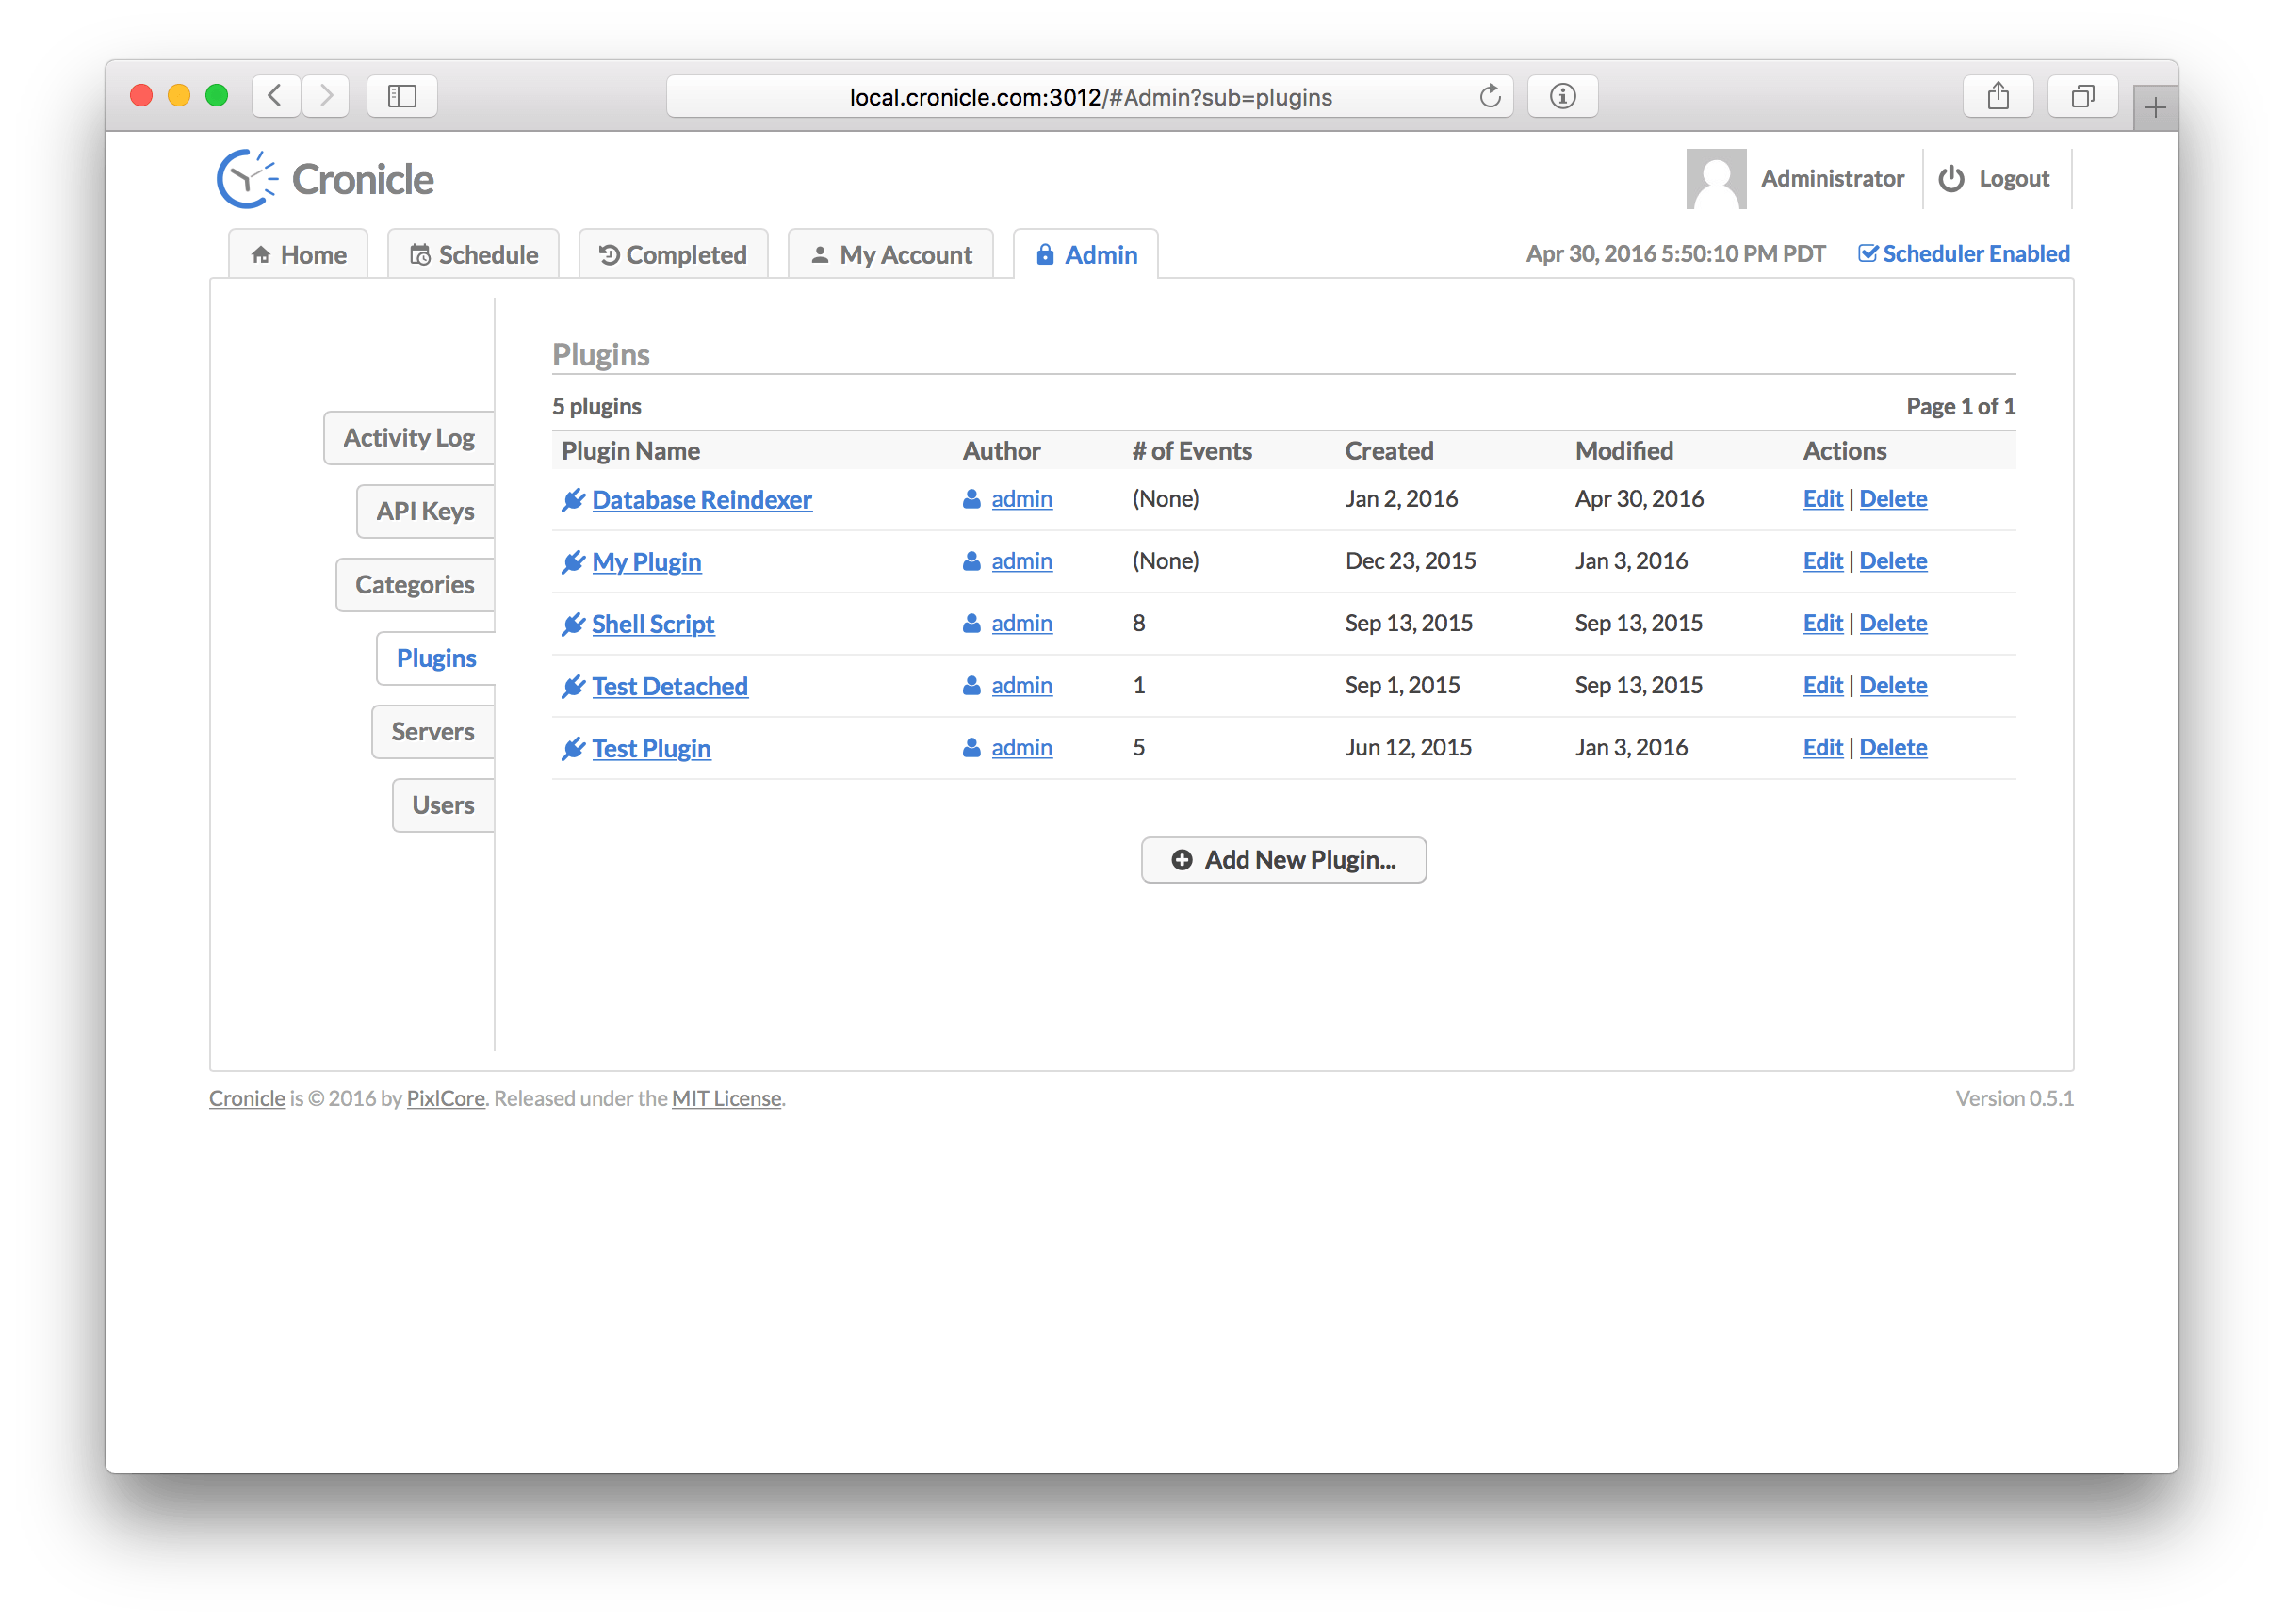
On this screen you'll find a list of all the Plugins registered in the system. The table columns are as follows:
| Column | Description |
|---|---|
| Plugin Name | The name of the Plugin, used for display purposes. |
| Author | The username of the user who originally created the Plugin. |
| Number of Events | The number of events using the Plugin. |
| Created | The date when the Plugin was first created. |
| Modified | The date when the Plugin was last modified. |
| Actions | A list of actions to take (edit and delete). |
When you create or edit a Plugin, you are taken to this screen:
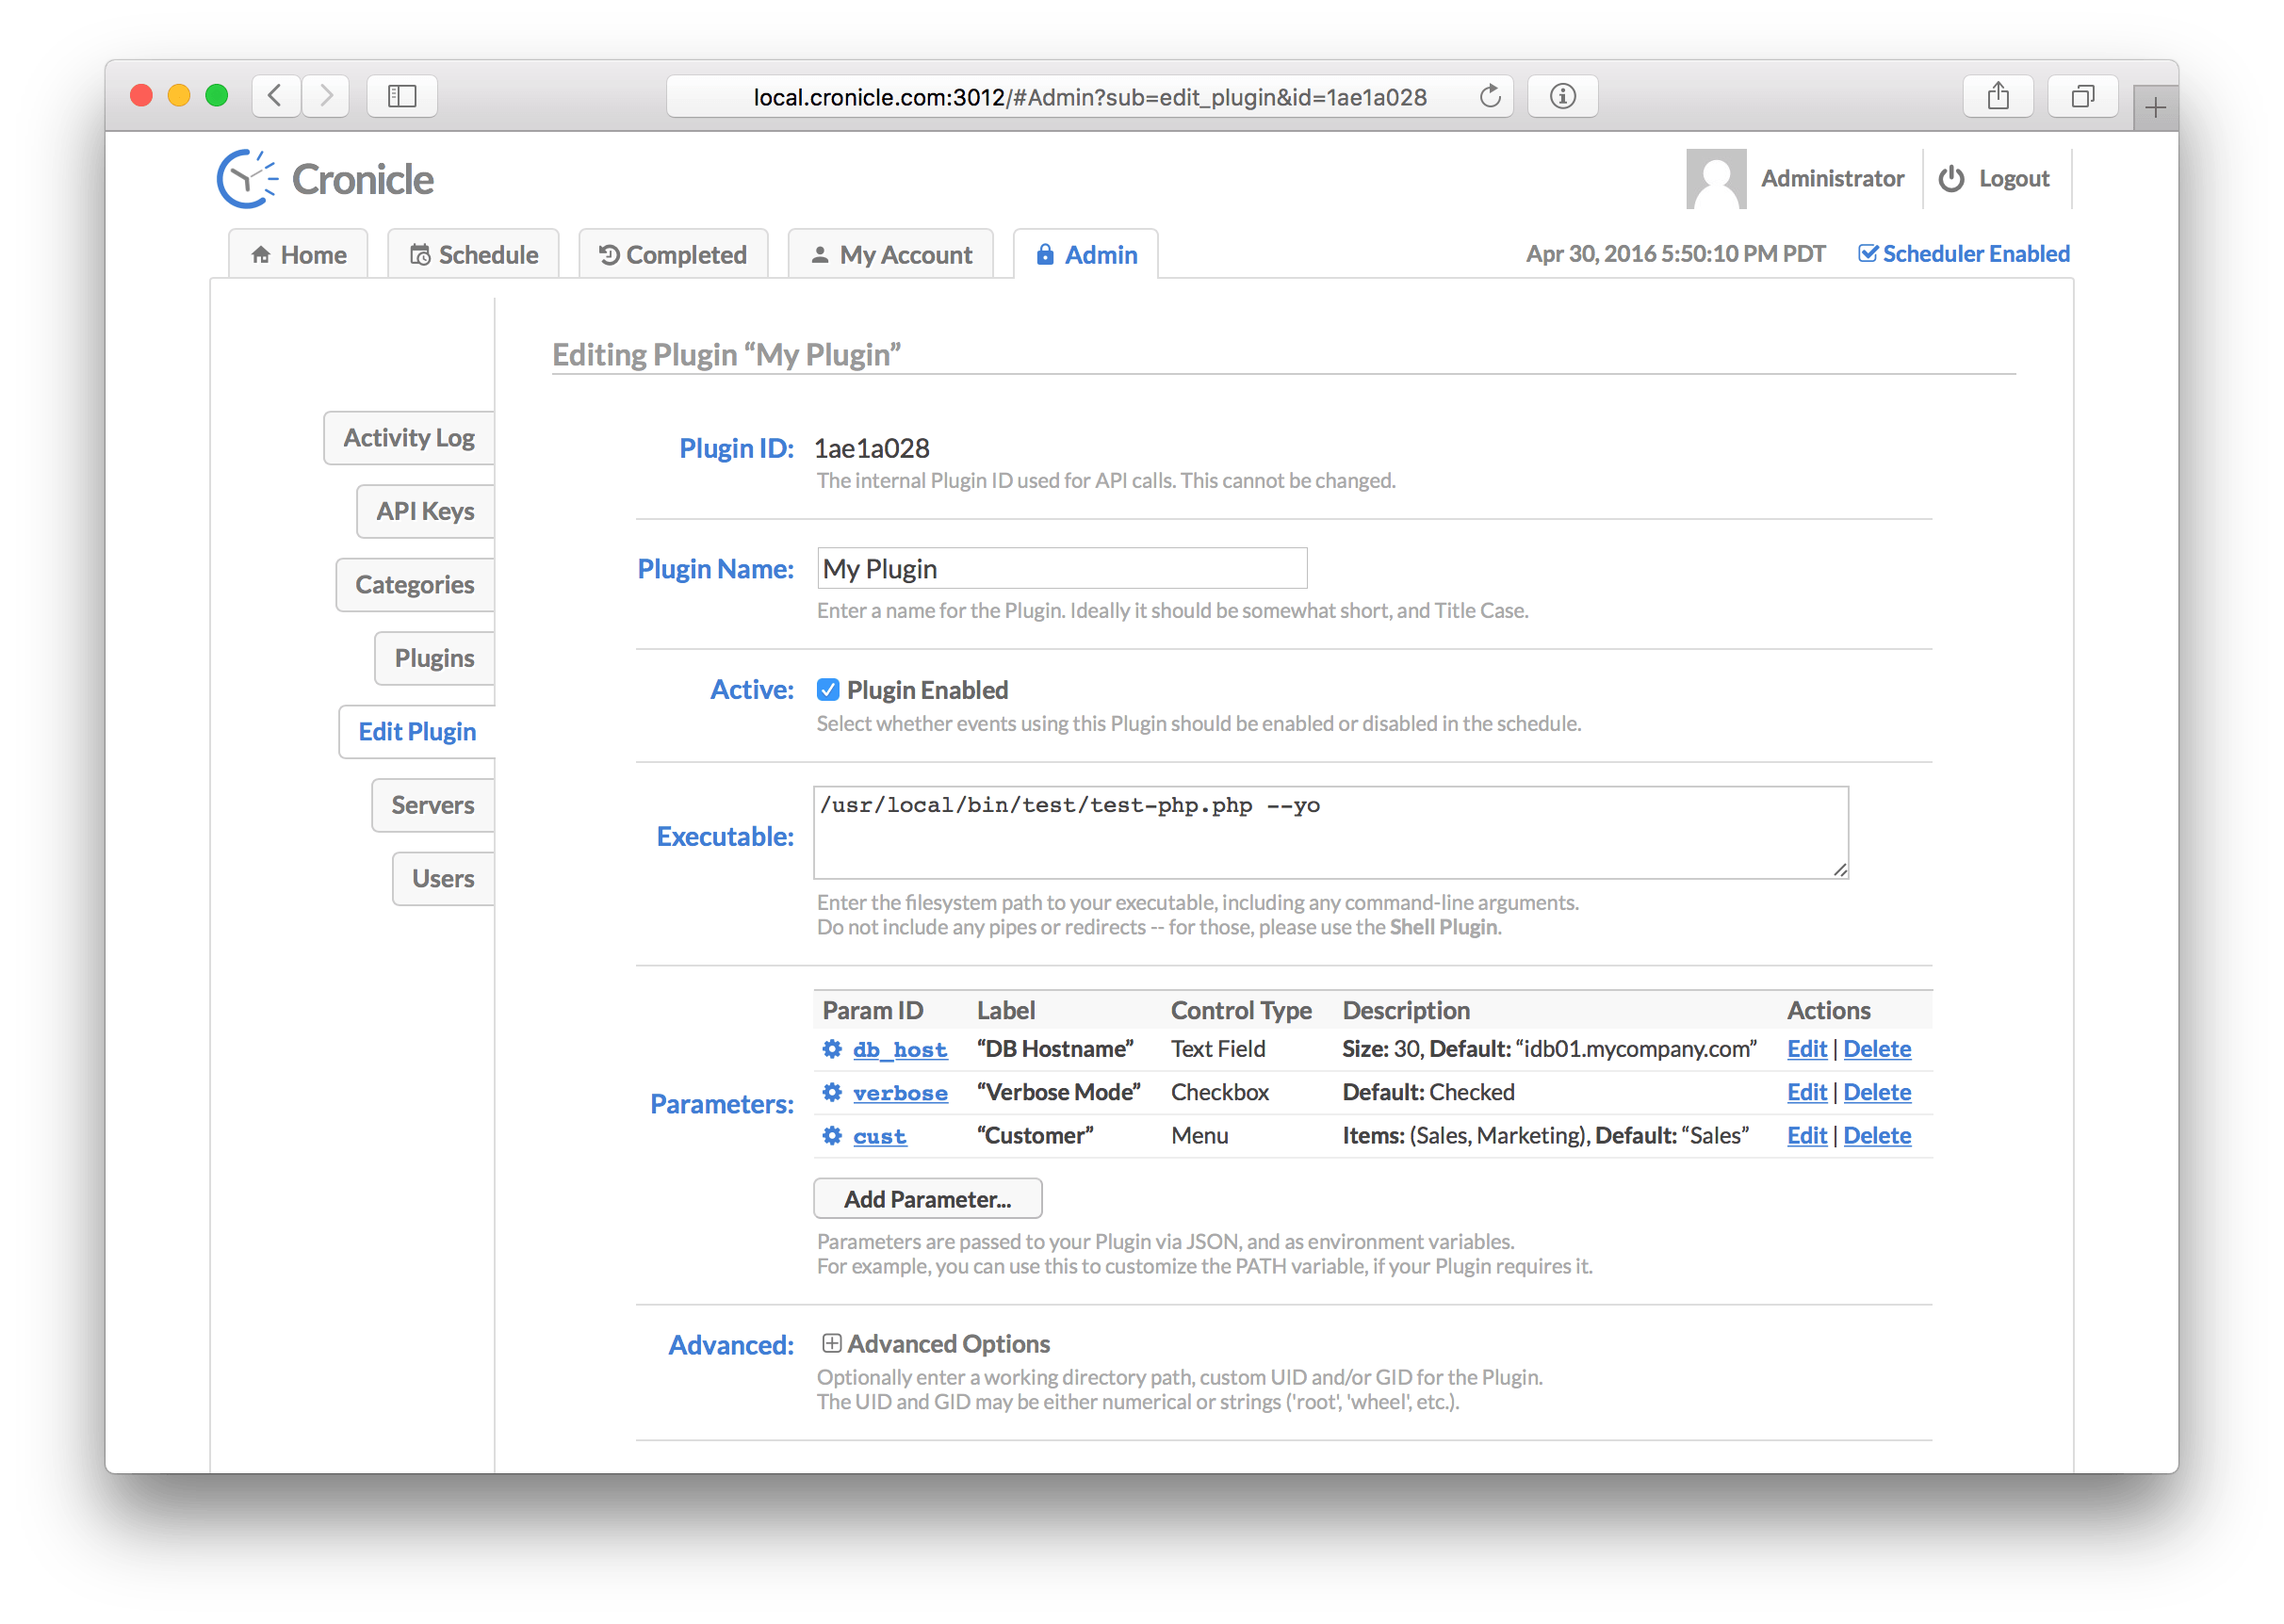
The Plugin edit form contains the following elements:
- The Plugin ID which is an auto-generated alphanumeric ID used only by the API. This cannot be changed.
- The Plugin Name which is used for display purposes.
- The Status which controls whether the Plugin is active or disabled. This also affects all events assigned to the Plugin, meaning if the Plugin is disabled, all the events assigned to it will also be effectively disabled as well (the scheduler won't start jobs for them).
- The Executable path, which is executed in a sub-process to run jobs. You may include command-line arguments here if your Plugin requires them, but no shell redirects or pipes (see the Shell Plugin if you need those).
- A set of custom Parameters which you can define here, and then edit later for each event. These parameters are then passed to your Plugin when jobs run. See below for details.
- A set of Advanced Options, including customizing the working directory, and user/group (all optional). See below for details.
The Parameter system allows you to define a set of UI controls for your Plugin (text fields, text boxes, checkboxes, drop-down menus, etc.) which are then presented to the user when editing events. This can be useful if your Plugin has configurable behavior which you want to expose to people creating events in the schedule. Each Parameter has an ID which identifies the user's selection, and is included in the JSON data sent to your Plugin for each job.
When adding or editing Plugin Parameters, you will be presented with this dialog:
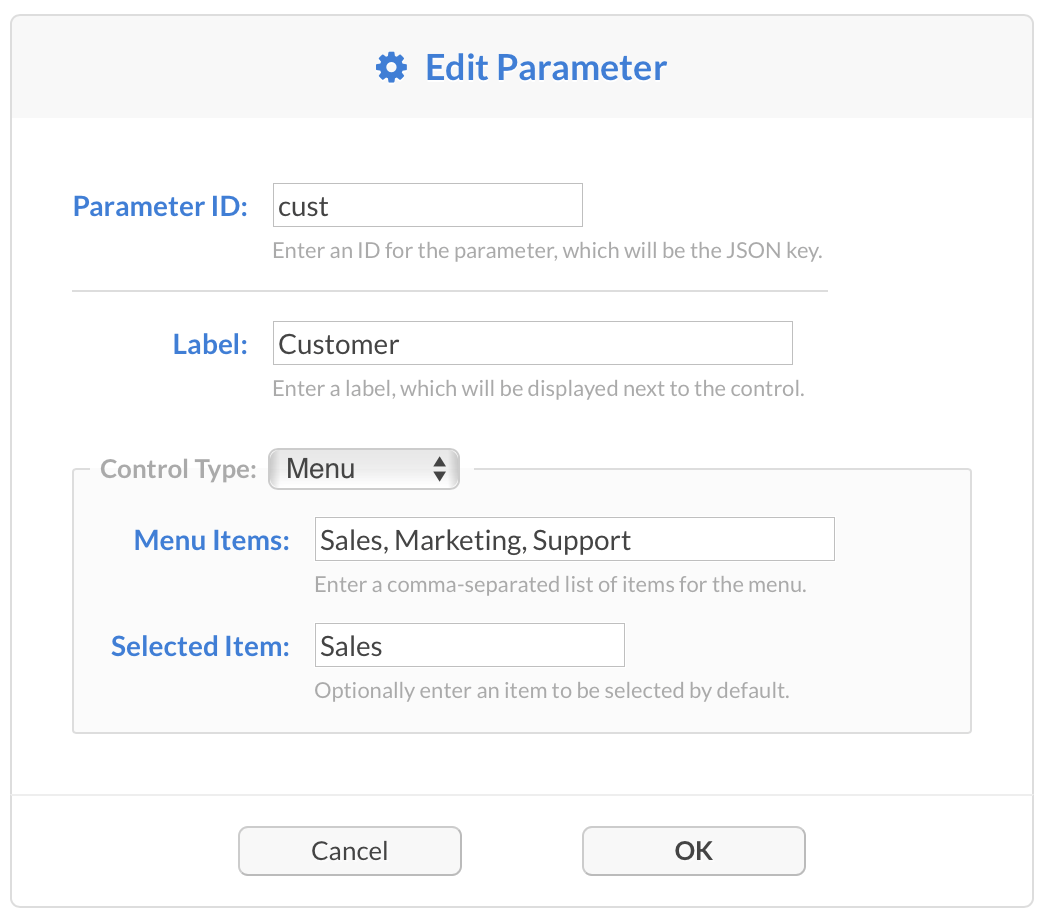
Here you will need to provide:
- A Parameter ID which uniquely identifies the parameter in the JSON data sent to your Plugin.
- A Label for display purposes (used in the UI only).
- A Control Type selection, which can be a text field, a text box, a checkbox, a drop-down menu, or a hidden variable.
Depending on the control type selected, you may need to provide different pieces of information to render the control in the UI, such as a comma-separated list of values for a menu, a default text field value and size, etc.
Parameter values for each event are passed to your Plugin when jobs are launched. These arrive as a JSON object (located in params), as well as upper-case environment variables. So for example, you can use Plugin Parameters to set custom environment variables for your jobs, or override existing ones such as PATH. Example of this:
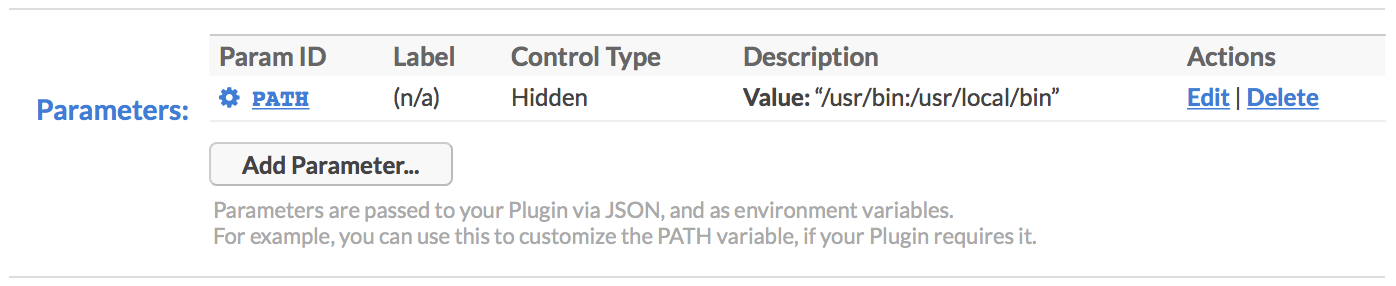
For more details on how to use these parameters in your Plugin code, see the Plugins section below.
The Advanced options pane expands to the following:
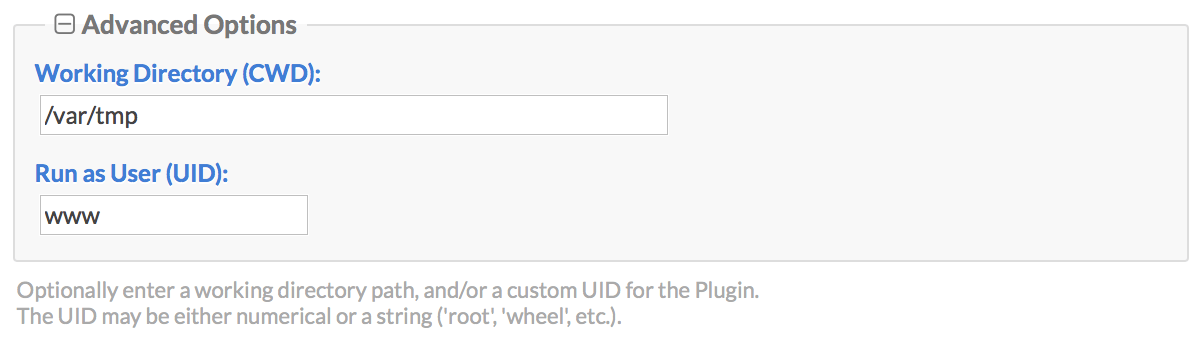
Here you can customize the following settings:
| Option | Description |
|---|---|
| Working Directory | This is the directory path to set as the current working directory when your jobs are launched. It defaults to the Cronicle base directory (/opt/cronicle). |
| Run as User | You can optionally run your jobs as another user by entering their UID here. A username string is also acceptable (and recommended, as UIDs may differ between servers). |
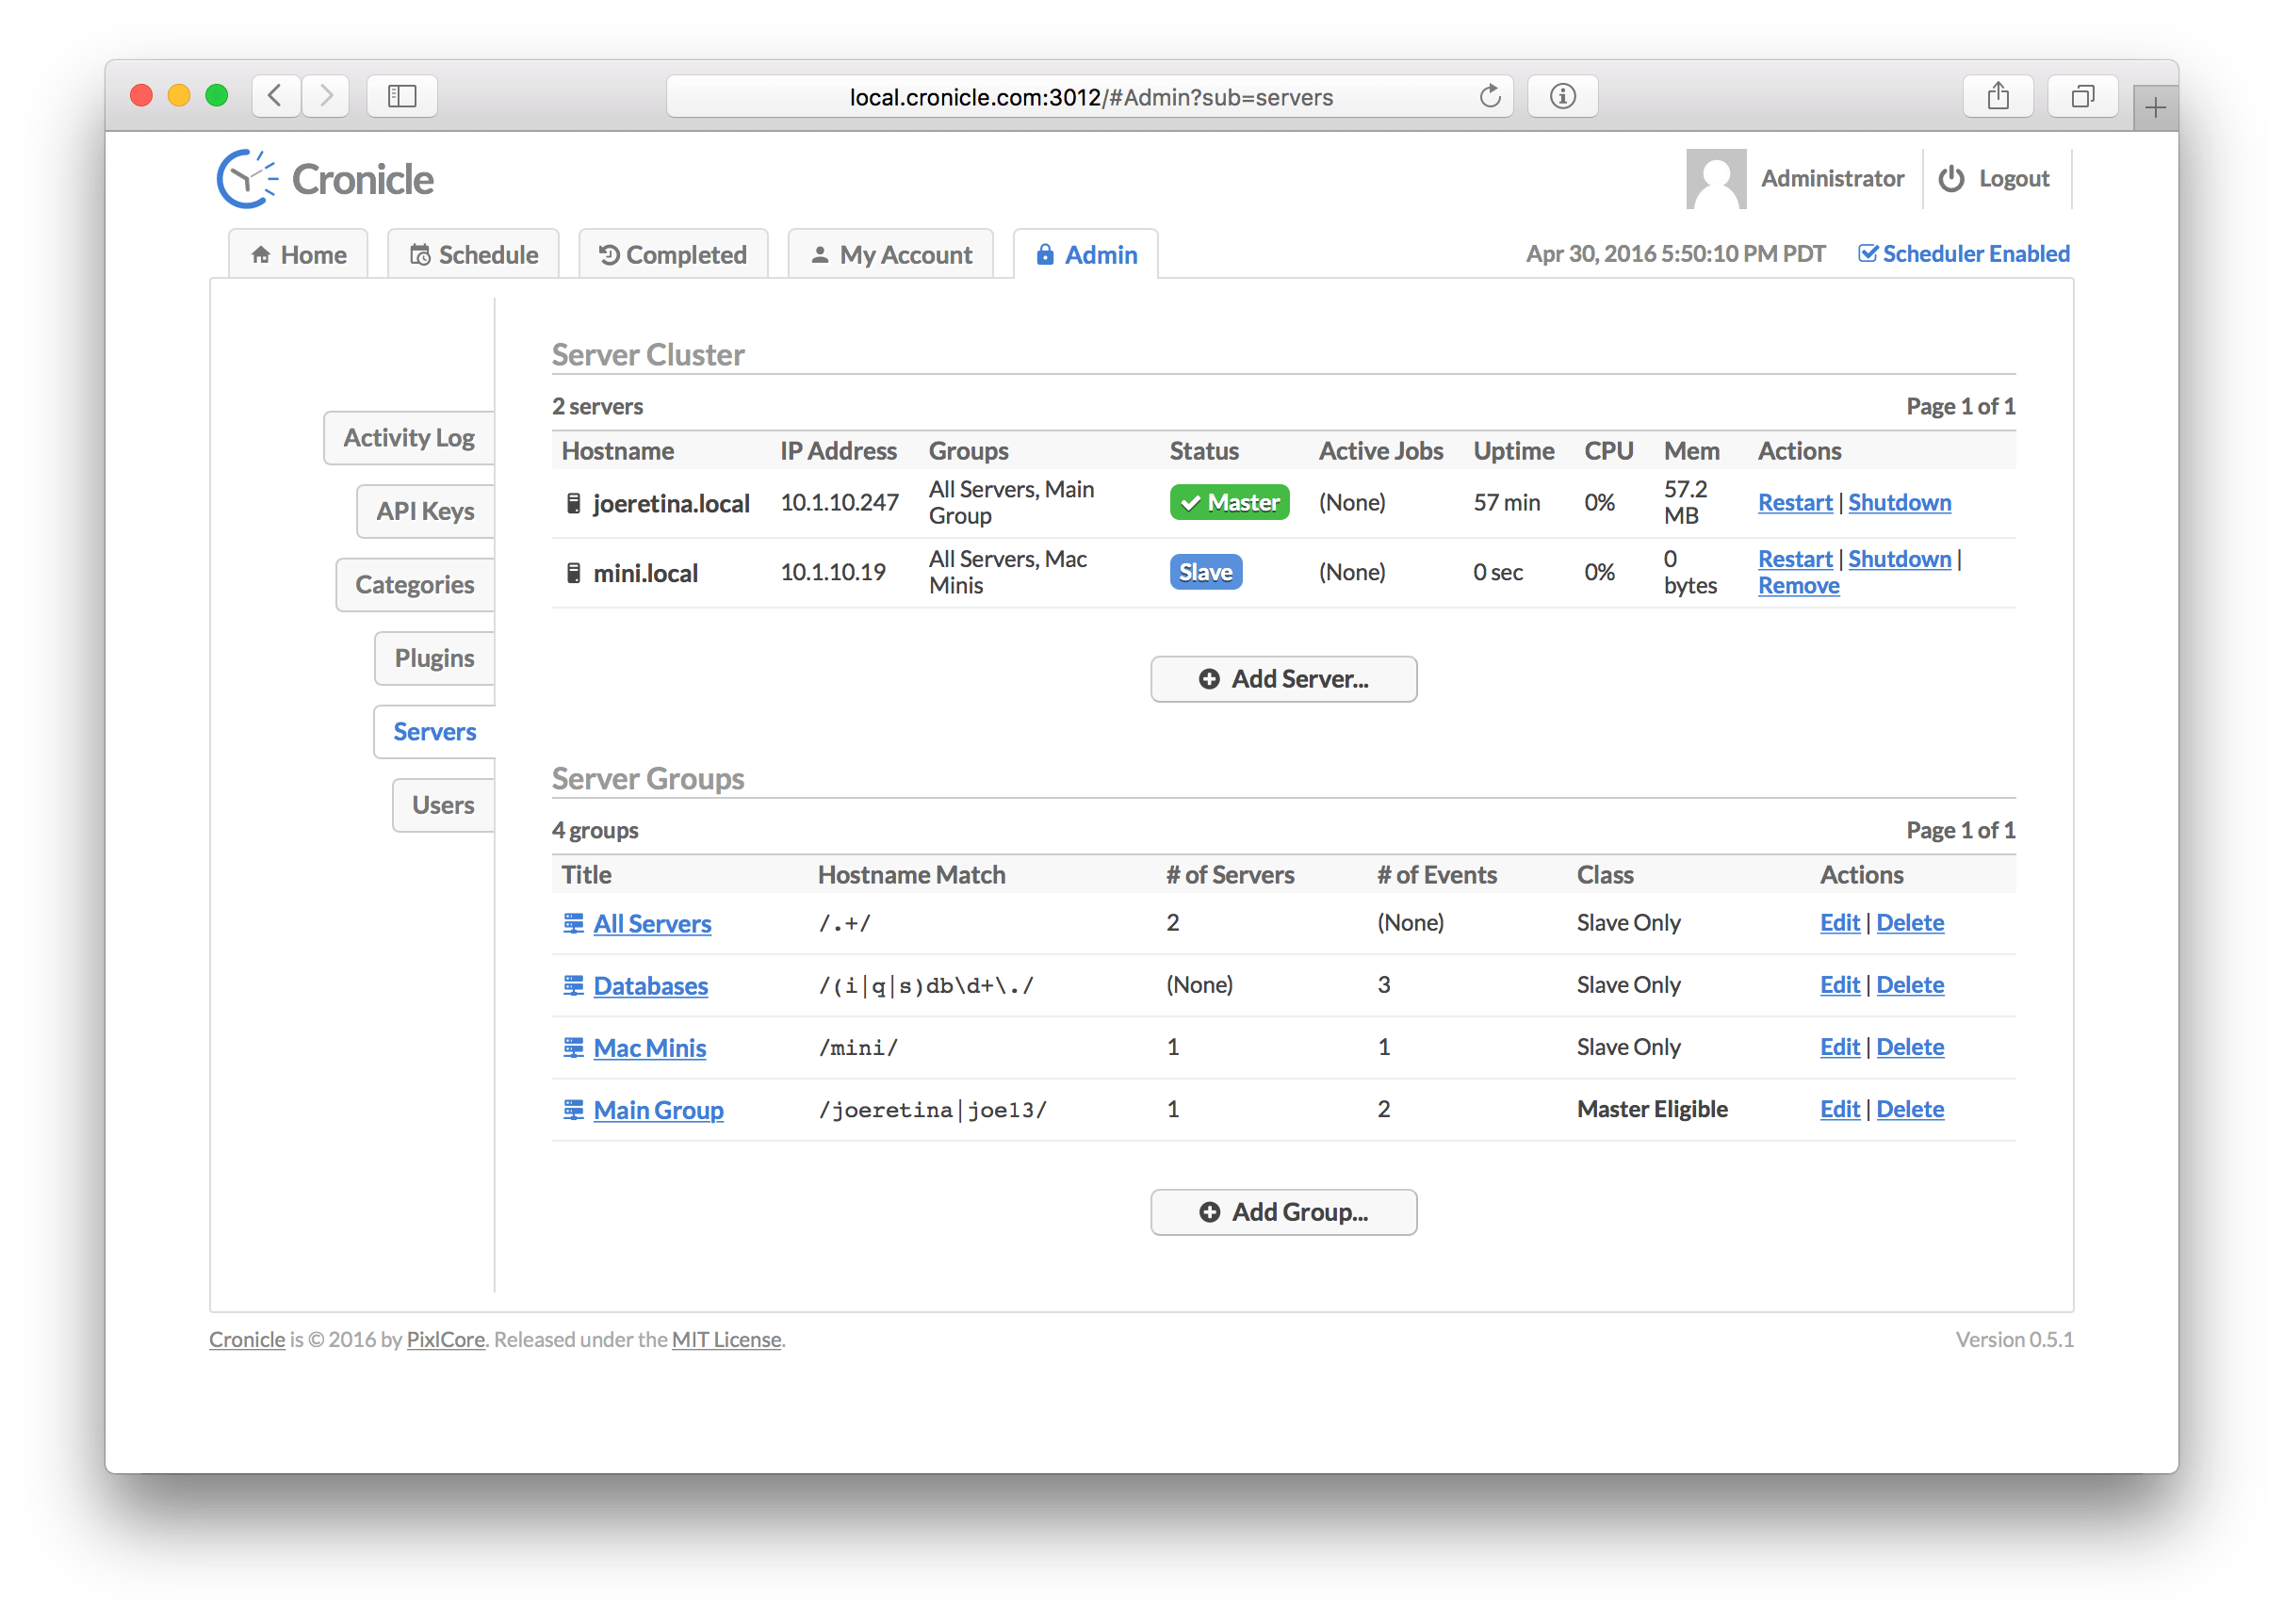
When Cronicle is configured to run in a multi-server environment, this tab allows you to manage the cluster. At the top of the page you'll see a list of all the servers currently registered, their status, and controls to restart or shut them down. The table columns include:
| Column | Description |
|---|---|
| Hostname | The hostname of the server. |
| IP Address | The IP address of the server. |
| Groups | A list of the groups to which the server belongs. |
| Status | The current server status (primary, backup or worker). |
| Active Jobs | The number of active jobs currently running on the server. |
| Uptime | The elapsed time since Cronicle was restarted on the server. |
| CPU | The current CPU usage on the server (all jobs). |
| Memory | The current memory usage on the server (all jobs). |
| Actions | A list of actions to take (restart and shutdown). |
There is also an Add Server button, but note that servers on the same LAN should be automatically discovered and added to the cluster. You will only need to manually add a server if it lives in a remote location, outside of local UDP broadcast range.
Below the server cluster you'll find a list of server groups. These serve two purposes. First, you can define groups in order to target events at them. For example, an event can target the group of servers instead of an individual server, and one of the servers will be picked for each job (or, if Multiplex is enabled, all the servers at once). Second, you can use server groups to define which of your servers are eligible to become the primary server, if the current primary is shut down.
When Cronicle is first installed, two server groups are created by default. A "Primary Group" which contains only the current (primary) server, and an "All Servers" group, which contains all the servers (current and future). Groups automatically add servers by a hostname-based regular expression match. Therefore, when additional servers join the cluster, they will be assigned to groups automatically via their hostname.
The list of server groups contains the following columns:
| Column | Description |
|---|---|
| Title | The title of the server group. |
| Hostname Match | A hostname regular expression to automatically add servers to the group. |
| Number of Servers | The number of servers currently in the group. |
| Number of Events | The number of events currently targeting the group. |
| Class | The server group classification (whether it supports becoming primary or not). |
| Actions | A list of actions to take (edit and delete). |
When adding or editing a server group, you will be presented with this dialog:
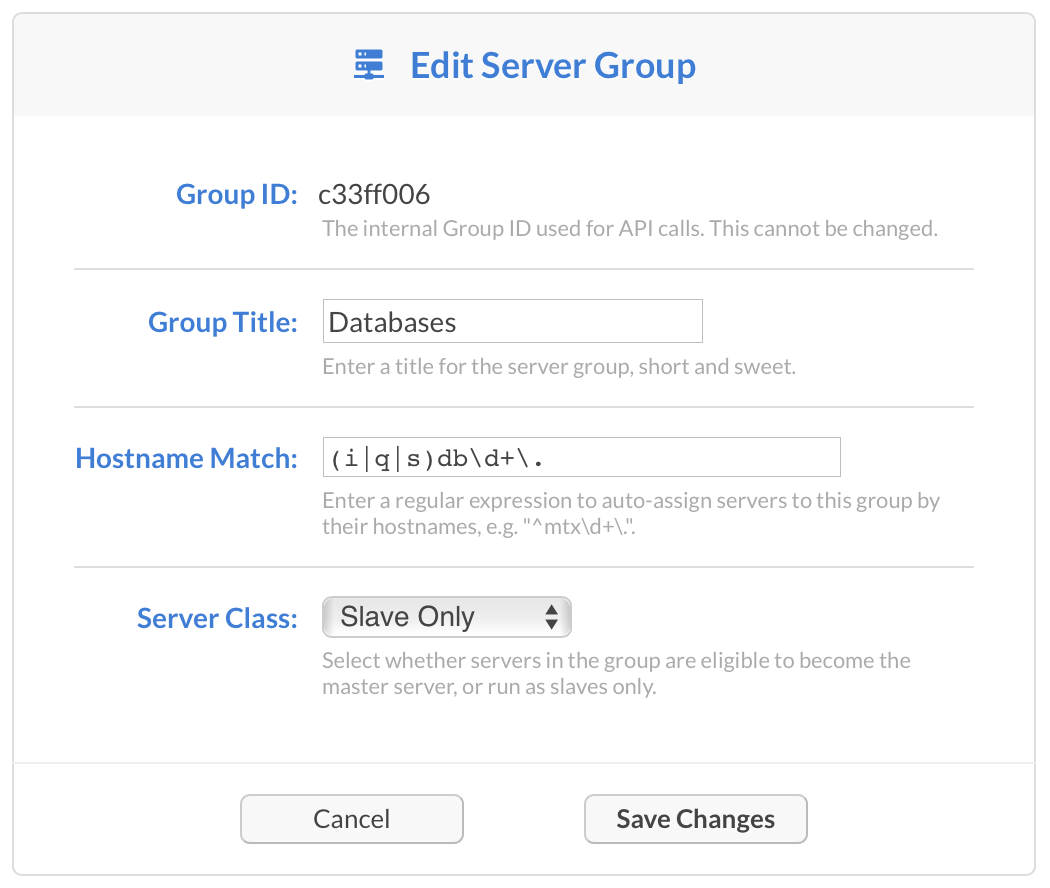
Here you will need to provide:
- A Group Title which is used for display purposes.
- A Hostname Match which is a regular expression applied to every server hostname (used to automatically add servers to the group).
- A Server Class which sets the servers in your group as "Primary Eligible" or "Worker Only".
Note that "Primary Eligible" servers all need to be properly configured and have access to your storage back-end. Meaning, if you opted to use the filesystem, you'll need to make sure it is mounted (via NFS or similar mechanism) on all the servers who could become primary. Or, if you opted to use a NoSQL DB such as Couchbase or S3, they need all the proper settings and/or credentials to connect. For more details, see the Multi-Server Cluster section.
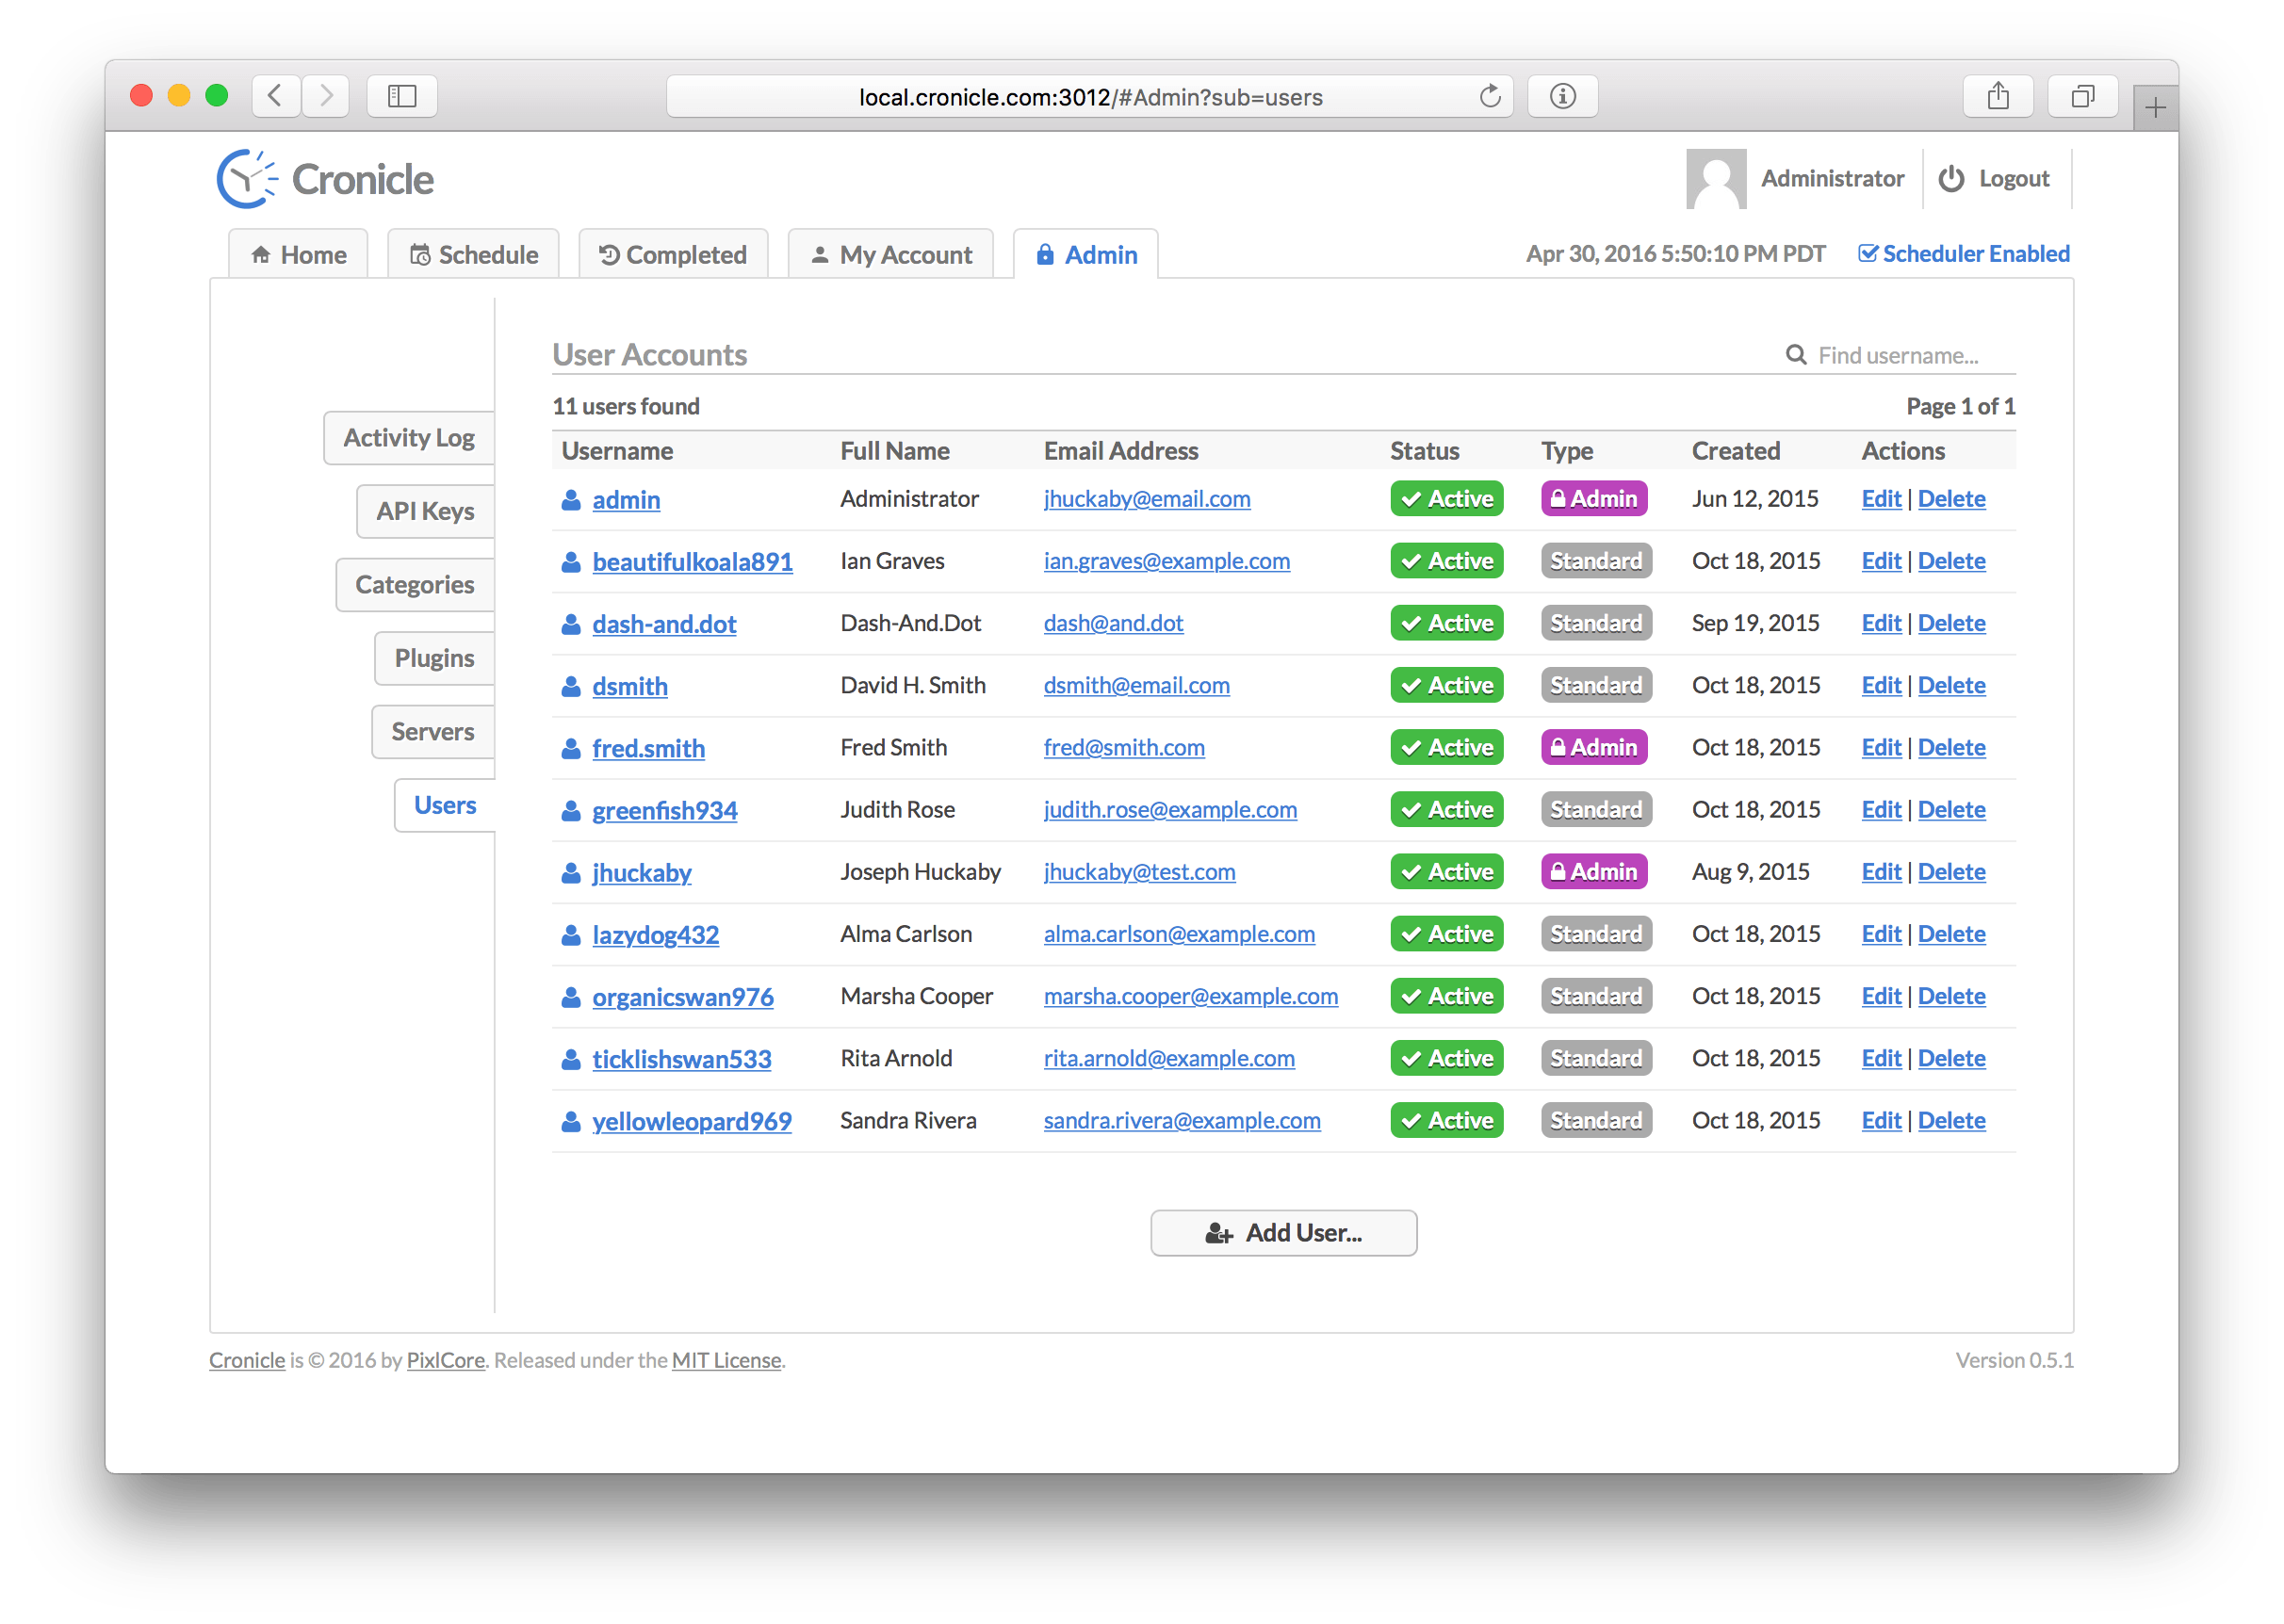
This tab shows you all the user accounts registered in the system, and allows you to edit, delete and add new ones. The table columns are as follows:
| Column | Description |
|---|---|
| Username | The account username. |
| Full Name | The user's full name. |
| Email Address | The user's e-mail address. |
| Status | The account status (active or disabled). |
| Type | The account type (standard or administrator). |
| Created | The date when the user was first created. |
| Actions | A list of actions to take (edit and delete). |
When you create or edit a user, you are taken to this screen:
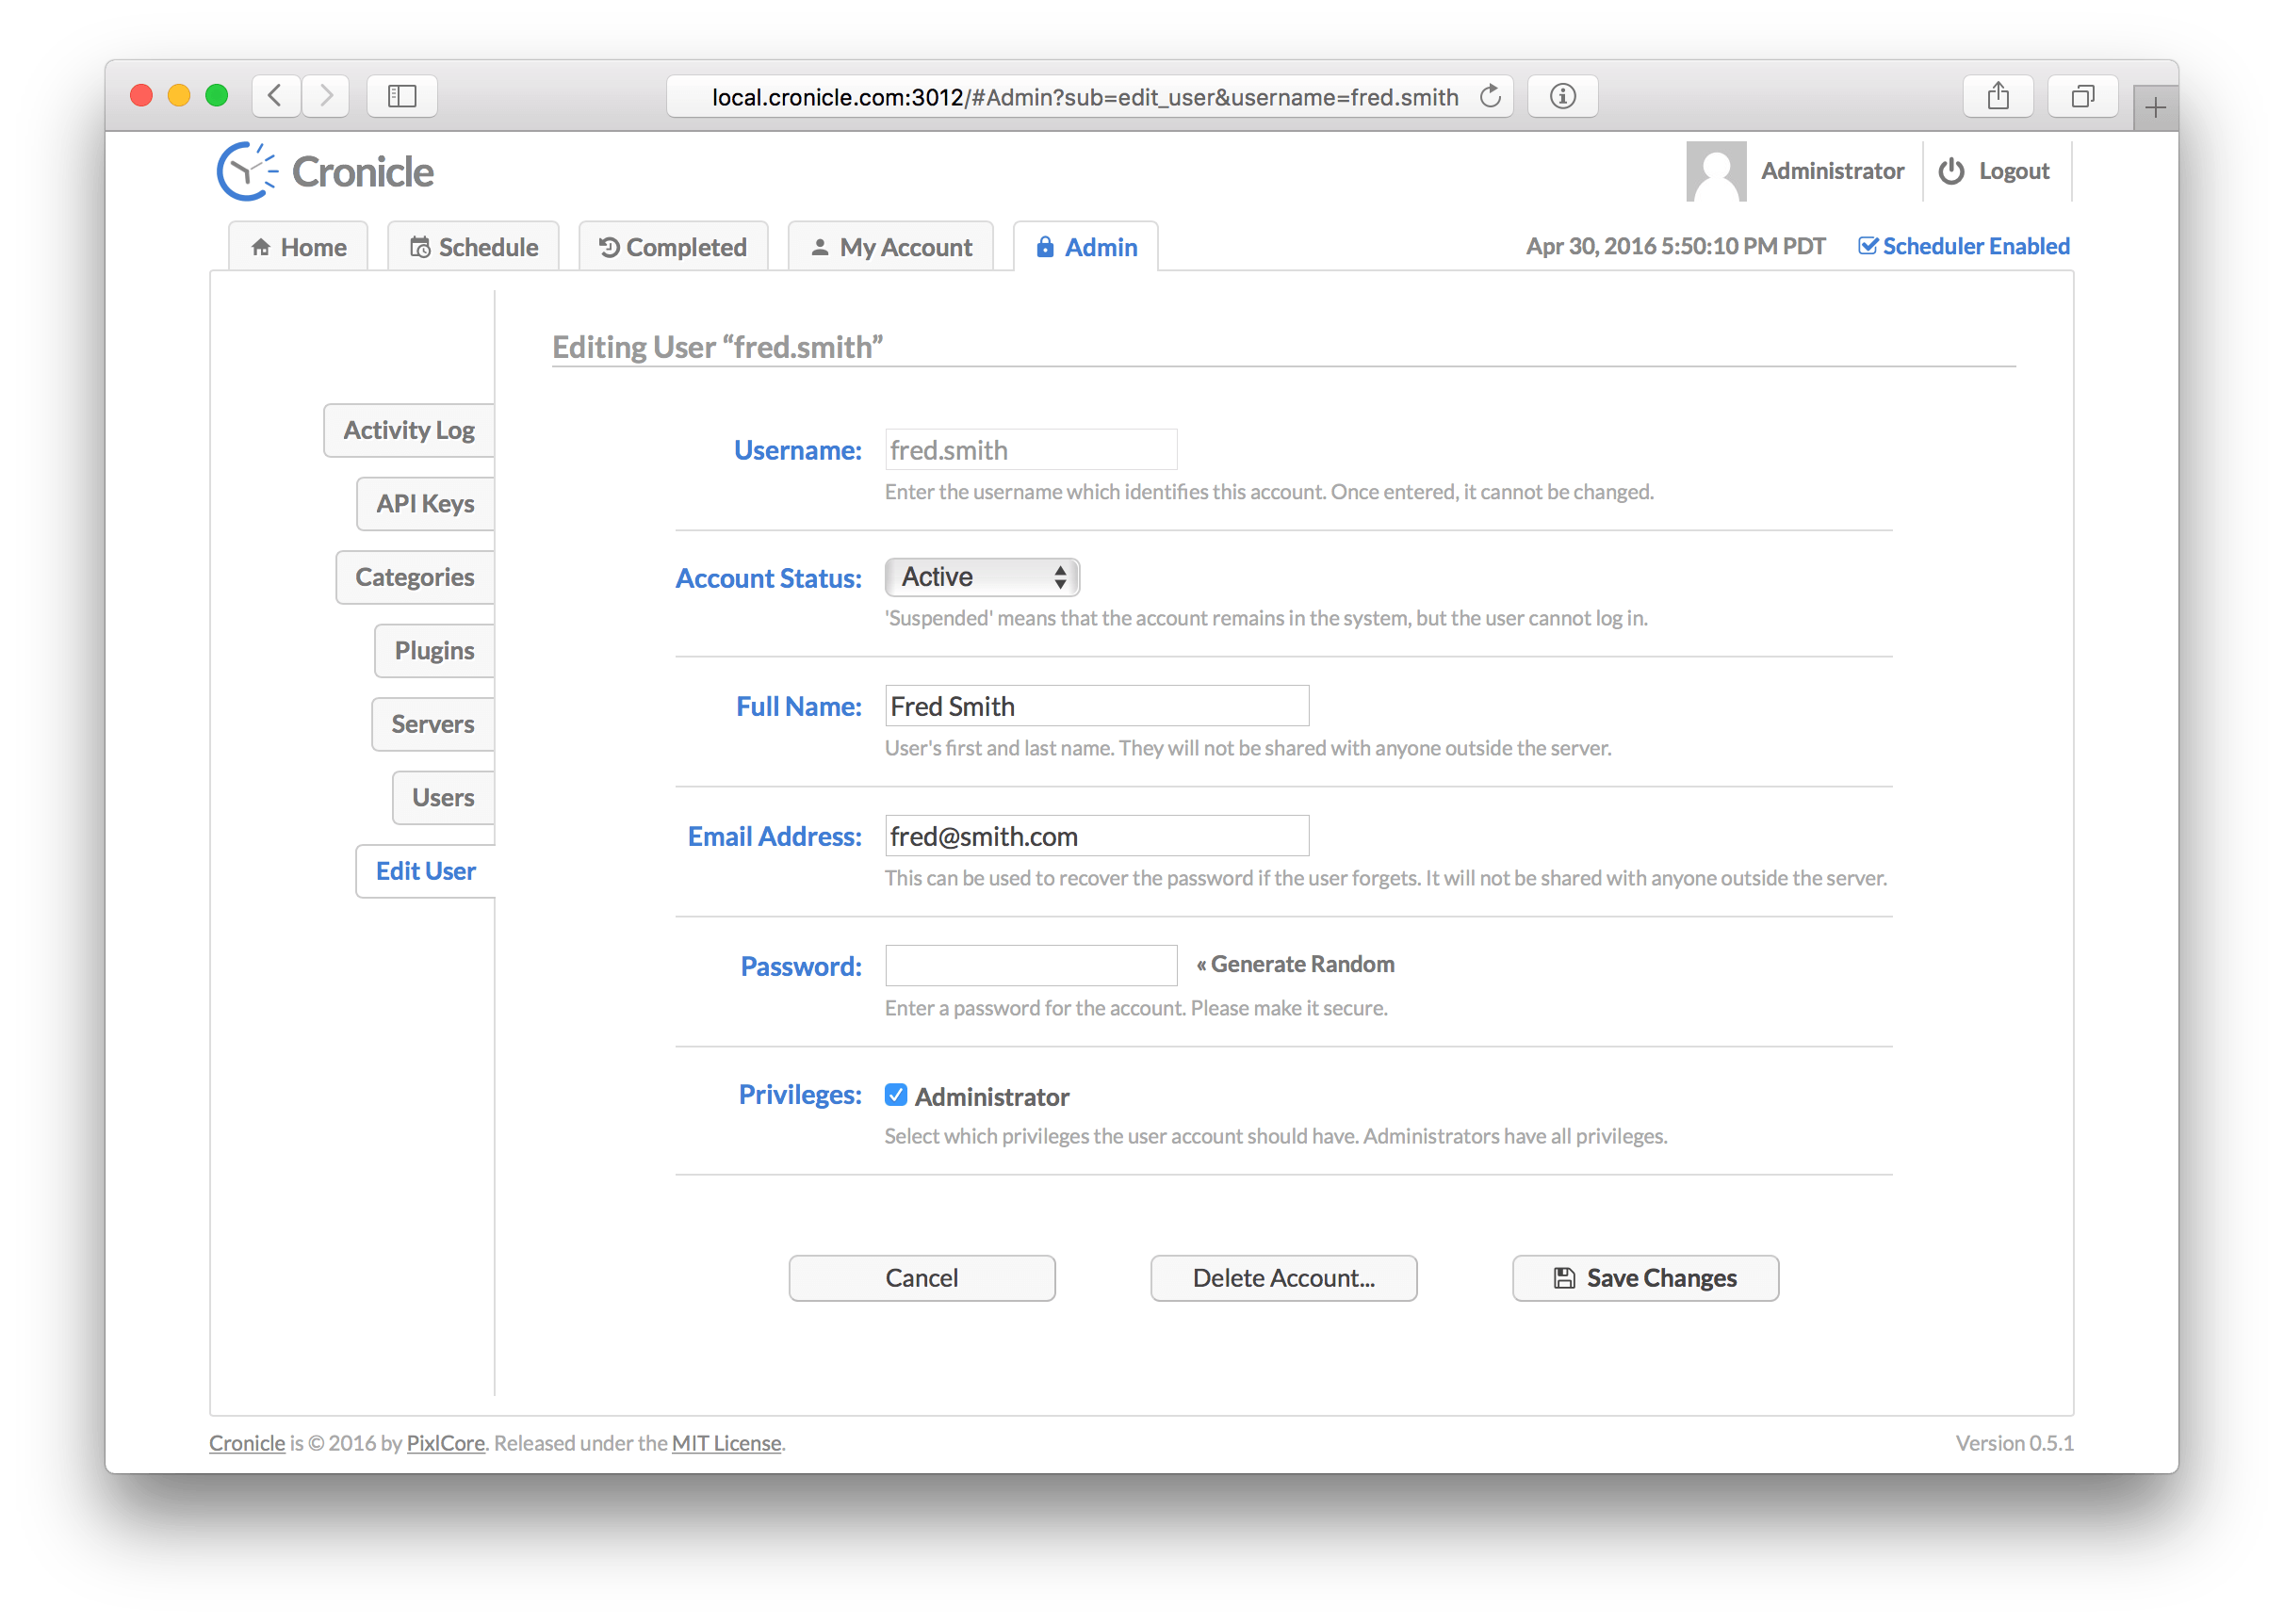
The user edit form contains the following elements:
- The Username, which cannot be edited after the user is created. Usernames may contain alphanumeric characters, periods and dashes.
- The Account Status which is either
ActiveorDisabled. Disabled accounts cannot login. - The user's Full Name, which is used for display purposes.
- The user's Email Address, which is used for event and error notifications.
- The account Password, which can be reset here, as well as randomized.
- A set of Privileges, which grant the user access to specific features of Cronicle.