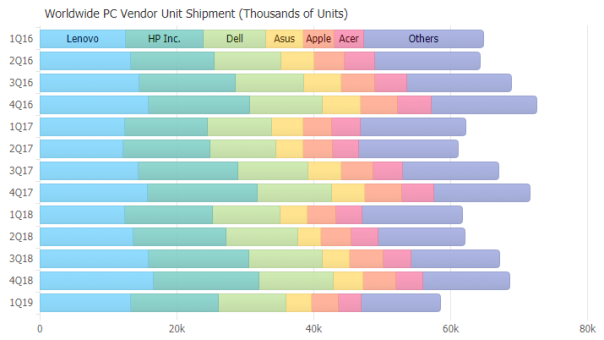
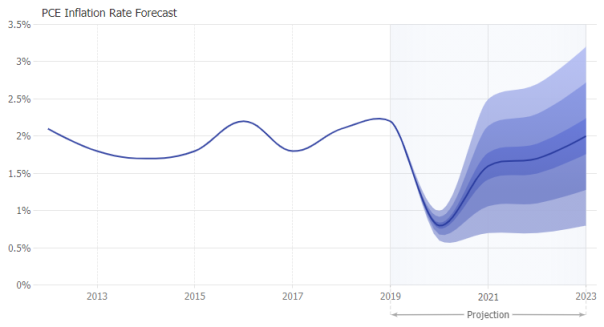
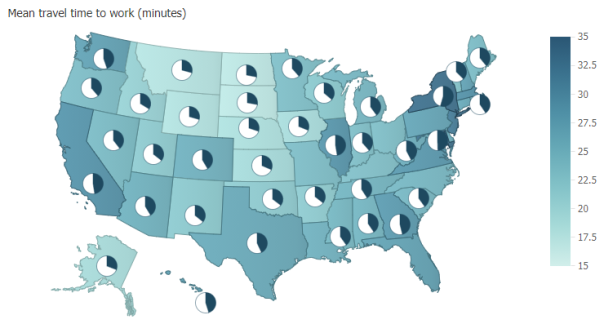
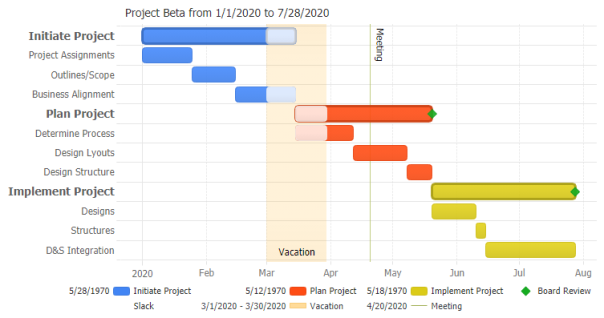
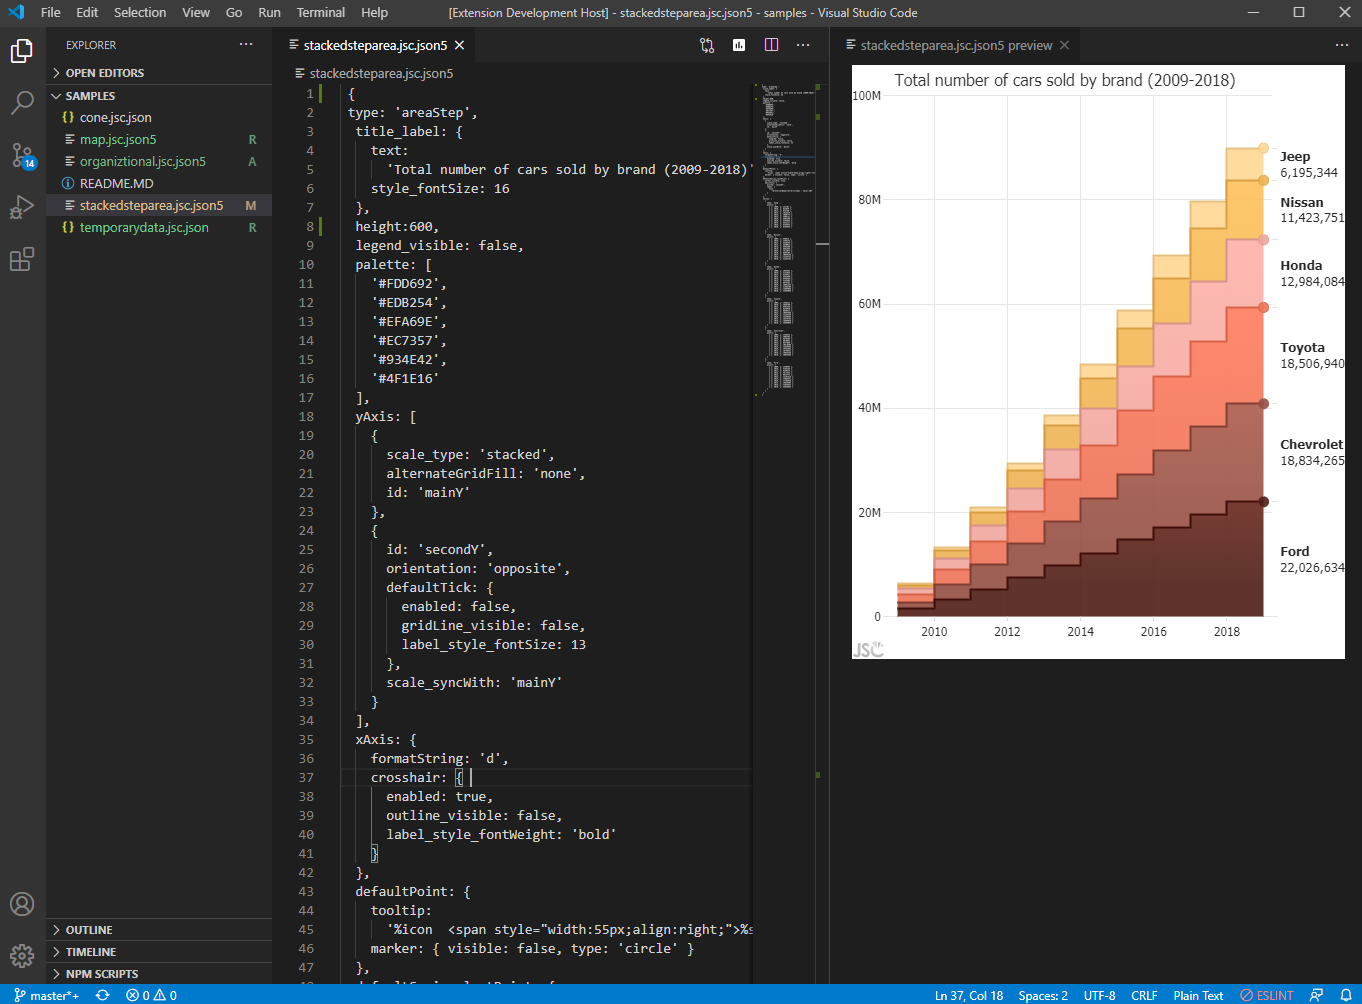
This extension provides JSCharting chart preview integration for Visual Studio Code.
JSCharting is a JavaScript data visualization library offering seamless usage with Vue across all devices and platforms. Every JSCharting license includes a full suite of 150+ chart types including standards such as pie charts, line charts, donut and bar charts. In addition, advanced chart types including Gantt charts, JavaScript Org Charts, interactive charts for stock and finance, seamless grid and calendar charts, JavaScript maps, sparklines, and micro charts all for no additional charge. JSCharting has all the features you need and many you don't yet know you want.
Example Charts: Chart Types | Feature Examples
A preview is available for *.jsc.json and *.jsc.json5 extensions that contain chart configurations.
JSCharting configuration can also be used in md files with jscharting codeblock to render charts in preview mode.
Run the JSCharting: Preview Chart command from View > Command Palette... or click the preview icon ![]() in the editor to preview the chart.
in the editor to preview the chart.
Visit the vscode-jscharting GitHub page for example JSON files and the source code of this extension.
To preview charts embedded in MD documents, wrap your JSON chart options using the following syntax and preview the MD document.
```jscharting
{
    type:'column',
    series:[{
        points: [ ['A',5], ['B', 6] ]
    }]
}
```
Visit the JSCharting getting started page for more information on chart options.
