The objective of the project is to estimate the time-to-death for patients diagnosed with lung cancer.
- Data Visualization
- Survival Analysis
- Kaplan-Meier Estimator
- Nelson-Aalen Estimator
- Log-Rank Test
- Cox's Proportional Hazard Model
- Jupyter Notebook
- Python 3.8.1
- Python Packages
- pandas
- numpy
- lifelines KaplanMeierFitter
- lifelines NelsonAalenFitter
- lifelines logrank_test
- lifelines CoxPHFitter
- Python Virtual Environment
- If necessary, install the python3-venv package using the following command: sudo apt install python3.8-venv
- Create a virtual environment with: python3 -m venv survival-wkspc
- cd into the survival-wkspace folder
- Activate the environment: source bin/activate
- Install python packages: python3 -m pip -r requirements.txt
- What is the impact of specific clinical characteristics on patients' survival?
- EG: Is there a difference between people who have high blood sugar and those who do not?
- What is the probability that an individual survives a specific time?
- EG: Given a set of cancer patients, what is the probability that a patient will be alive at that time if some set of time has passed?
- What, if any, are the differences in survival between groups of patients?
- EG: Compare the effects of two different treatments.
- Survival Time - The amount of time until an event
- Events could be birth, death, product failure, etc...
- Relapse - A deterioration in the subject's state of health after a temporary improvement
- Progression - The process of developing or moving gradually towards a more advanced state
- Data Censoring - Occurs when observations do not experience the event of interest
- EG: In the study of a product's failure, some products might not fail
- Right Censoring - Occurs when the subject under observation does not or has not yet experienced the event
- EG: When studying death, a patient might still be alive
- Left Censoring - Occurs when the event cannot be observed
- EG: The event could have occurred before the study began
- Interval Censoring - Occurs when the data is for a specific time interval
- EG: The event of interest might occur before or after, but not during the study
- Survival Function (S)
- Defined as the probability that a subject survives from the diagnosis of a disease to a specified future time, t
- Focuses on the survival of a subject
- EG: S(200) = 0.7 means that after 200 days, a subject's probability of survival is 0.7
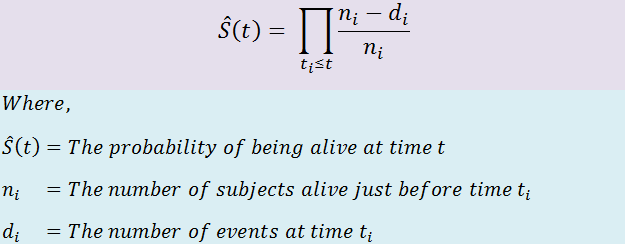
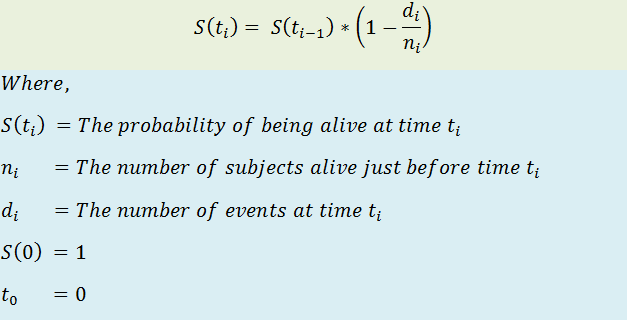
- Kaplan-Meier Estimator is used to find the survival probability of a subject
- Hazard Function (H)
- Defined as the a subject under observation at time t has an event at time t
- Focuses on the death of a subject
- EG: H(200) = 0.7 means that on or after 200 days, the probability of death is 0.7
- NOTE: The Hazard Function gives us the cumulative probability
- Is a non-parametric statistic used to estimate the survival function from the lifetime data
- Often used to measure the fraction of patients living for a specific time after treatment or diagnosis
- These plots help to visualize survival curves
- Is a non-parametric statistic used to estimate hazard rates
- Often used to measure the fraction of patients who have died for at or by a specified time after treatment or diagnosis
- Aggregate information regarding survival can be visualized using the Nelson-Aalen hazard function, h(t). The hazard function gives us the probability that a subject under observation at time t has an event of interest at that time
- NOTE: The hazard rate CANNOT be found by transforming the survival rate
- Is a hypothesis test that is used to compare the survival distributions of two samples with the goal of determining if there is any significant difference between the groups compared.
- The null hypothesis states that there is no significant difference between groups being studied.
- Is a regression model used, generally, by medical researchers to determine the relationship between the survival time of a subject and one or more predictor variables. It helps us to determine how different parameters such as age, sex, weight, height, etc.. affect the survival time of a subject.
- Unlike the Kaplan-Meier Estimator, the Nelson-Aalen Estimator, and the Log-Rank Test, Cox's Proportional Hazard Regression Analysis works for both categorical and non-categorical predictors.
- In short, it is used to determine how different factors impact the event of interest.
- Hazard Ratio (HR)
- HR = value of exp(bi) from the Hazard Function
- HR = 1 : No Effects
- HR < 1 : Reduction in Hazard
- HR > 1 : Increase in Hazard


