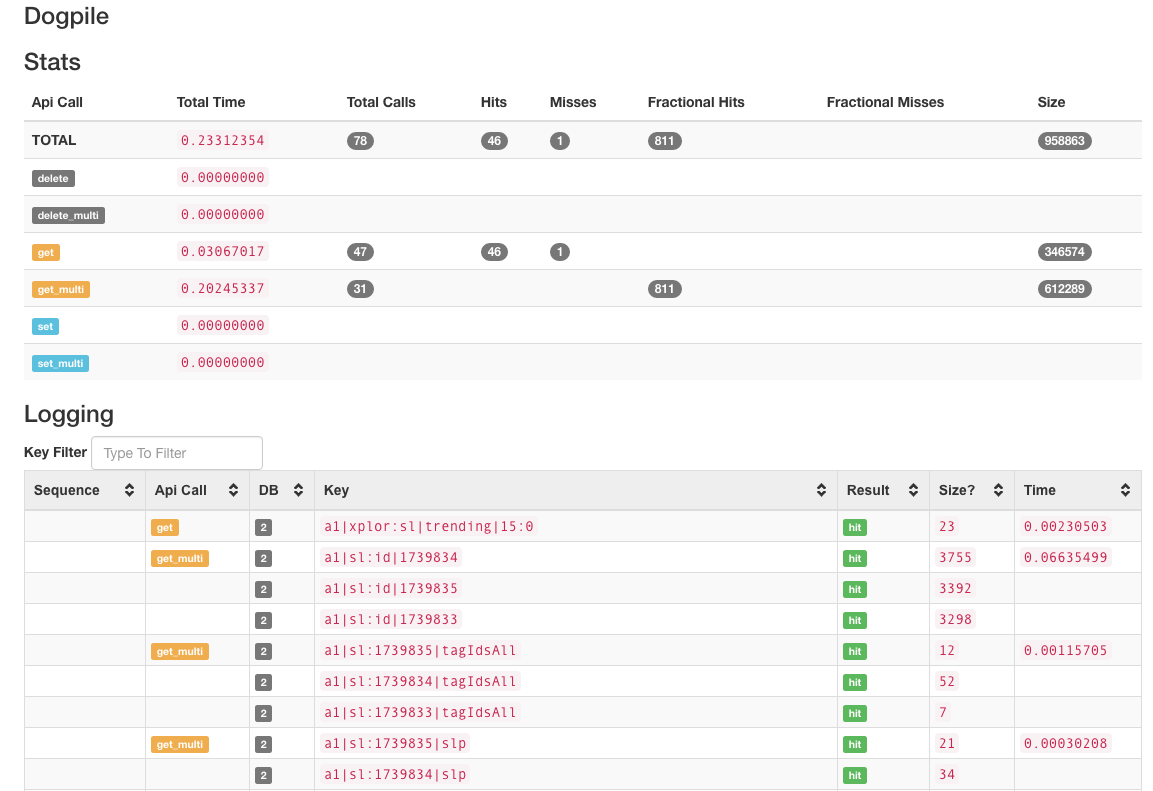
dogpile caching support for pyramid_debugtoolbar
This package tracks the following dogpile api calls :
get
get_multi
set
set_multi
delete
delete_multi
Your pyramid_debugtoolbar will have a "Dogpile" panel that lists:
- the number of calls (in tab header)
- statistics on cache hits/misses/timing per api call type
- a listing of all calls that features: call, key, hit/miss, timing
As of v0.1.4 you can filter the keys on the panel. yay.
This package works by wrapping requests to dogpile regions into a Proxy Backend. This has a significant performance overhead and relies on the DEBUG ONLY get_current_request, so make sure that you disable this LoggingProxy on production machines.
As of v0.1.5 you can sort-of track payload sizes. This is very experimental. See below.
This package works in Python2.7 and Python 3.x
pip install pyramid_debugtoolbar_dogpile
easy_install pyramid_debugtoolbar_dogpile
pyramid.includes = pyramid_debugtoolbar
debugtoolbar.includes = pyramid_debugtoolbar_dogpile
from pyramid_debugtoolbar_dogpile import LoggingProxy as DogpileLoggingProxy

cache_config = {}
...
cache_config['wrap'] = [DogpileLoggingProxy, ]
region = make_region()
region.configure_from_config(cache_config)
Tracking Payload Size is experimental and VERY TRICKY because the correct hooks do not live in the standard packages. Most users will not be able to do it -- or want to do it.
NOTE: This breaks/abuses dogpile's API.
In order to track payload size, you must write a custom backend OR use a backend that supports custom serializers, and "repack" the CachedValues with a "sz" attribute in the metadata.
This specialized serialize for an alternate Redis backend, https://github.com/jvanasco/dogpile_backend_redis_advanced, injects a payload size attribute into CachedValues
def SerializerPickleInt_loads(value):
	"""build a new CachedValue"""
	serialized_size = len(value)
	value = cPickle.loads(value)
	return CachedValue(value[0],
					   {"ct": value[1],
						"v": value_version,
						"sz": serialized_size,
						})
If this package detects any size payloads in the tracked values, it will display size columns that report the number of bytes per key (and in aggregate reports). If the package
does not detect any sz payloads, it will not display the "Size" columns.
Why track size?
Some routes in a project were taking too much time, even with caching. Tracking size - in addition to time - made it easier to pinpoint problematic objects and create a different/leaner caching object.
The panel renders in two parts:
First Section - topline statistics
Second Section - chronological list of cache operations. API calls and results are color-coded for quick review.
