This is a demo app for the https://github.com/keilerkonzept/topk library (specifically, the sliding package).
The app is a real-time TUI leaderboard visualising sliding-window counts for items read from standard input. It shows a list of top-k items and a time series plot of the sliding window contents showing per-tick counters for each item..
Contents
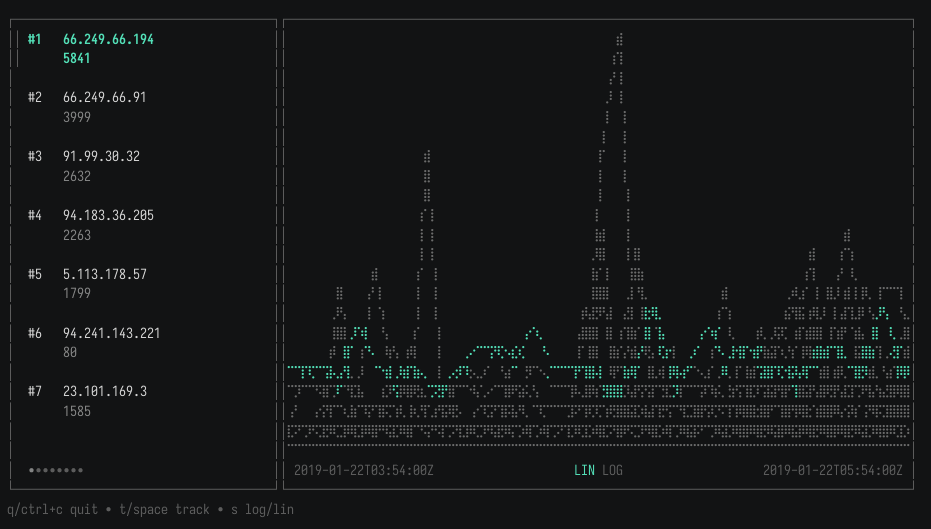
Here, we show the top requesting IPs within a 4h sliding window from a web server access logs dataset:
The input data looks like this:
31.56.96.51 - - [22/Jan/2019:03:56:16 +0330] "GET /image/60844/productModel/200x200 HTTP/1.1" 200 5667 "https://www.zanbil.ir/m/filter/b113" "Mozilla/5.0 (Linux; Android 6.0; ALE-L21 Build/HuaweiALE-L21) AppleWebKit/537.36 (KHTML, like Gecko) Chrome/66.0.3359.158 Mobile Safari/537.36" "-"
31.56.96.51 - - [22/Jan/2019:03:56:16 +0330] "GET /image/61474/productModel/200x200 HTTP/1.1" 200 5379 "https://www.zanbil.ir/m/filter/b113" "Mozilla/5.0 (Linux; Android 6.0; ALE-L21 Build/HuaweiALE-L21) AppleWebKit/537.36 (KHTML, like Gecko) Chrome/66.0.3359.158 Mobile Safari/537.36" "-"
40.77.167.129 - - [22/Jan/2019:03:56:17 +0330] "GET /image/14925/productModel/100x100 HTTP/1.1" 200 1696 "-" "Mozilla/5.0 (compatible; bingbot/2.0; +http://www.bing.com/bingbot.htm)" "-"
...
...and the visualisation is generated like this:
# read gzip'ed log, transform them into {item,timestamp} JSON objects,
# and feed them to the demo app.
<access.log.gz gunzip \
    | jq  -c -R '. | split(" ") | {item:.[0],timestamp:(.[3][1:]+" "+.[4][:-1])}' \
    | sliding-topk-tui-demo \
        -k 20 \
        -tick=5m \
        -window=4h \
        -json \
        -json-timestamp-layout="02/Jan/2006:15:04:05 -0700" \
-view-split 30If you have the Go toolchain installed:
$ go install github.com/keilerkonzept/sliding-topk-tui-demo@latestOr download a binary release.
- Input: Items are read from stdin, where each line represents either an item name (text mode) or a JSON object (in JSON mode).
- Counting: It uses our sliding-window implementation of HeavyKeeper to track approximate item frequencies over time.
- Leaderboard: The top-k items with their current counts are listed in order of their total count over the current window.
- Time Series Plot: The sliding window counters for all top-k items are plotted as a time series in the terminal. The series for the currently selected item is highlighted. You can switch between linear and logarithmic scale for the Y axis.
We use topk/sliding for the sketch and bubbletea for the TUI.
The tool is configured through command-line options.
-k(default: 50): Number of top items to track.-width(default: 3000): Width of the Top-K sketch.-depth(default: 3): Depth of the Top-K sketch.-window(default: 10s): Size of the sliding window.-tick(default: 1s): Size of the sketch time buckets.-decay(default: 0.9): Decay probability of counters on collisions.-plot-fps(default: 20): Refresh rate of the time series plot.-items-fps(default: 1): Refresh rate of the leaderboard list and ordering.-item-counts-fps(default: 5): Refresh rate of item count updates.-json: Reading JSON input records (with timestamps) instead of plain text.-json-timestamp-layout(default: RFC3339: Go time layout for parsing string timestamps in JSON input.
# count and track the top 10 items over a 30s sliding window using 1s counter buckets.
cat my_data.jsonl | sliding-topk-tui-demo -k 10 -tick 1s -window 30s -jsonIn text mode, each line represents a single item:
item1
item2
item1
item3
item2
In JSON mode, each line must be a JSON object with an item field, and optionally count and timestamp fields:
{"item": "item1", "count": 5, "timestamp": "2024-09-23T12:34:56Z"} // string timestamps are parsed as RFC3339 by default
{"item": "item2", "count": 2, "timestamp": 1695414906}             // int timestamps are assuemd to be unix (second precision) timestamps
{"item": "item1"}
If the count field is missing, it defaults to 1. If the timestamp field is missing, the read timestamp is used instead, and any further timestamps in the JSON data discarded from then on.
torspace: Toggle tracking of the selected item.s: Toggle between linear and logarithmic Y-axis scale for the time series plot.qorCtrl+C: Quit the application.- Arrow keys: Navigate the leaderboard.
Licensed under the MIT License. See LICENSE for details.