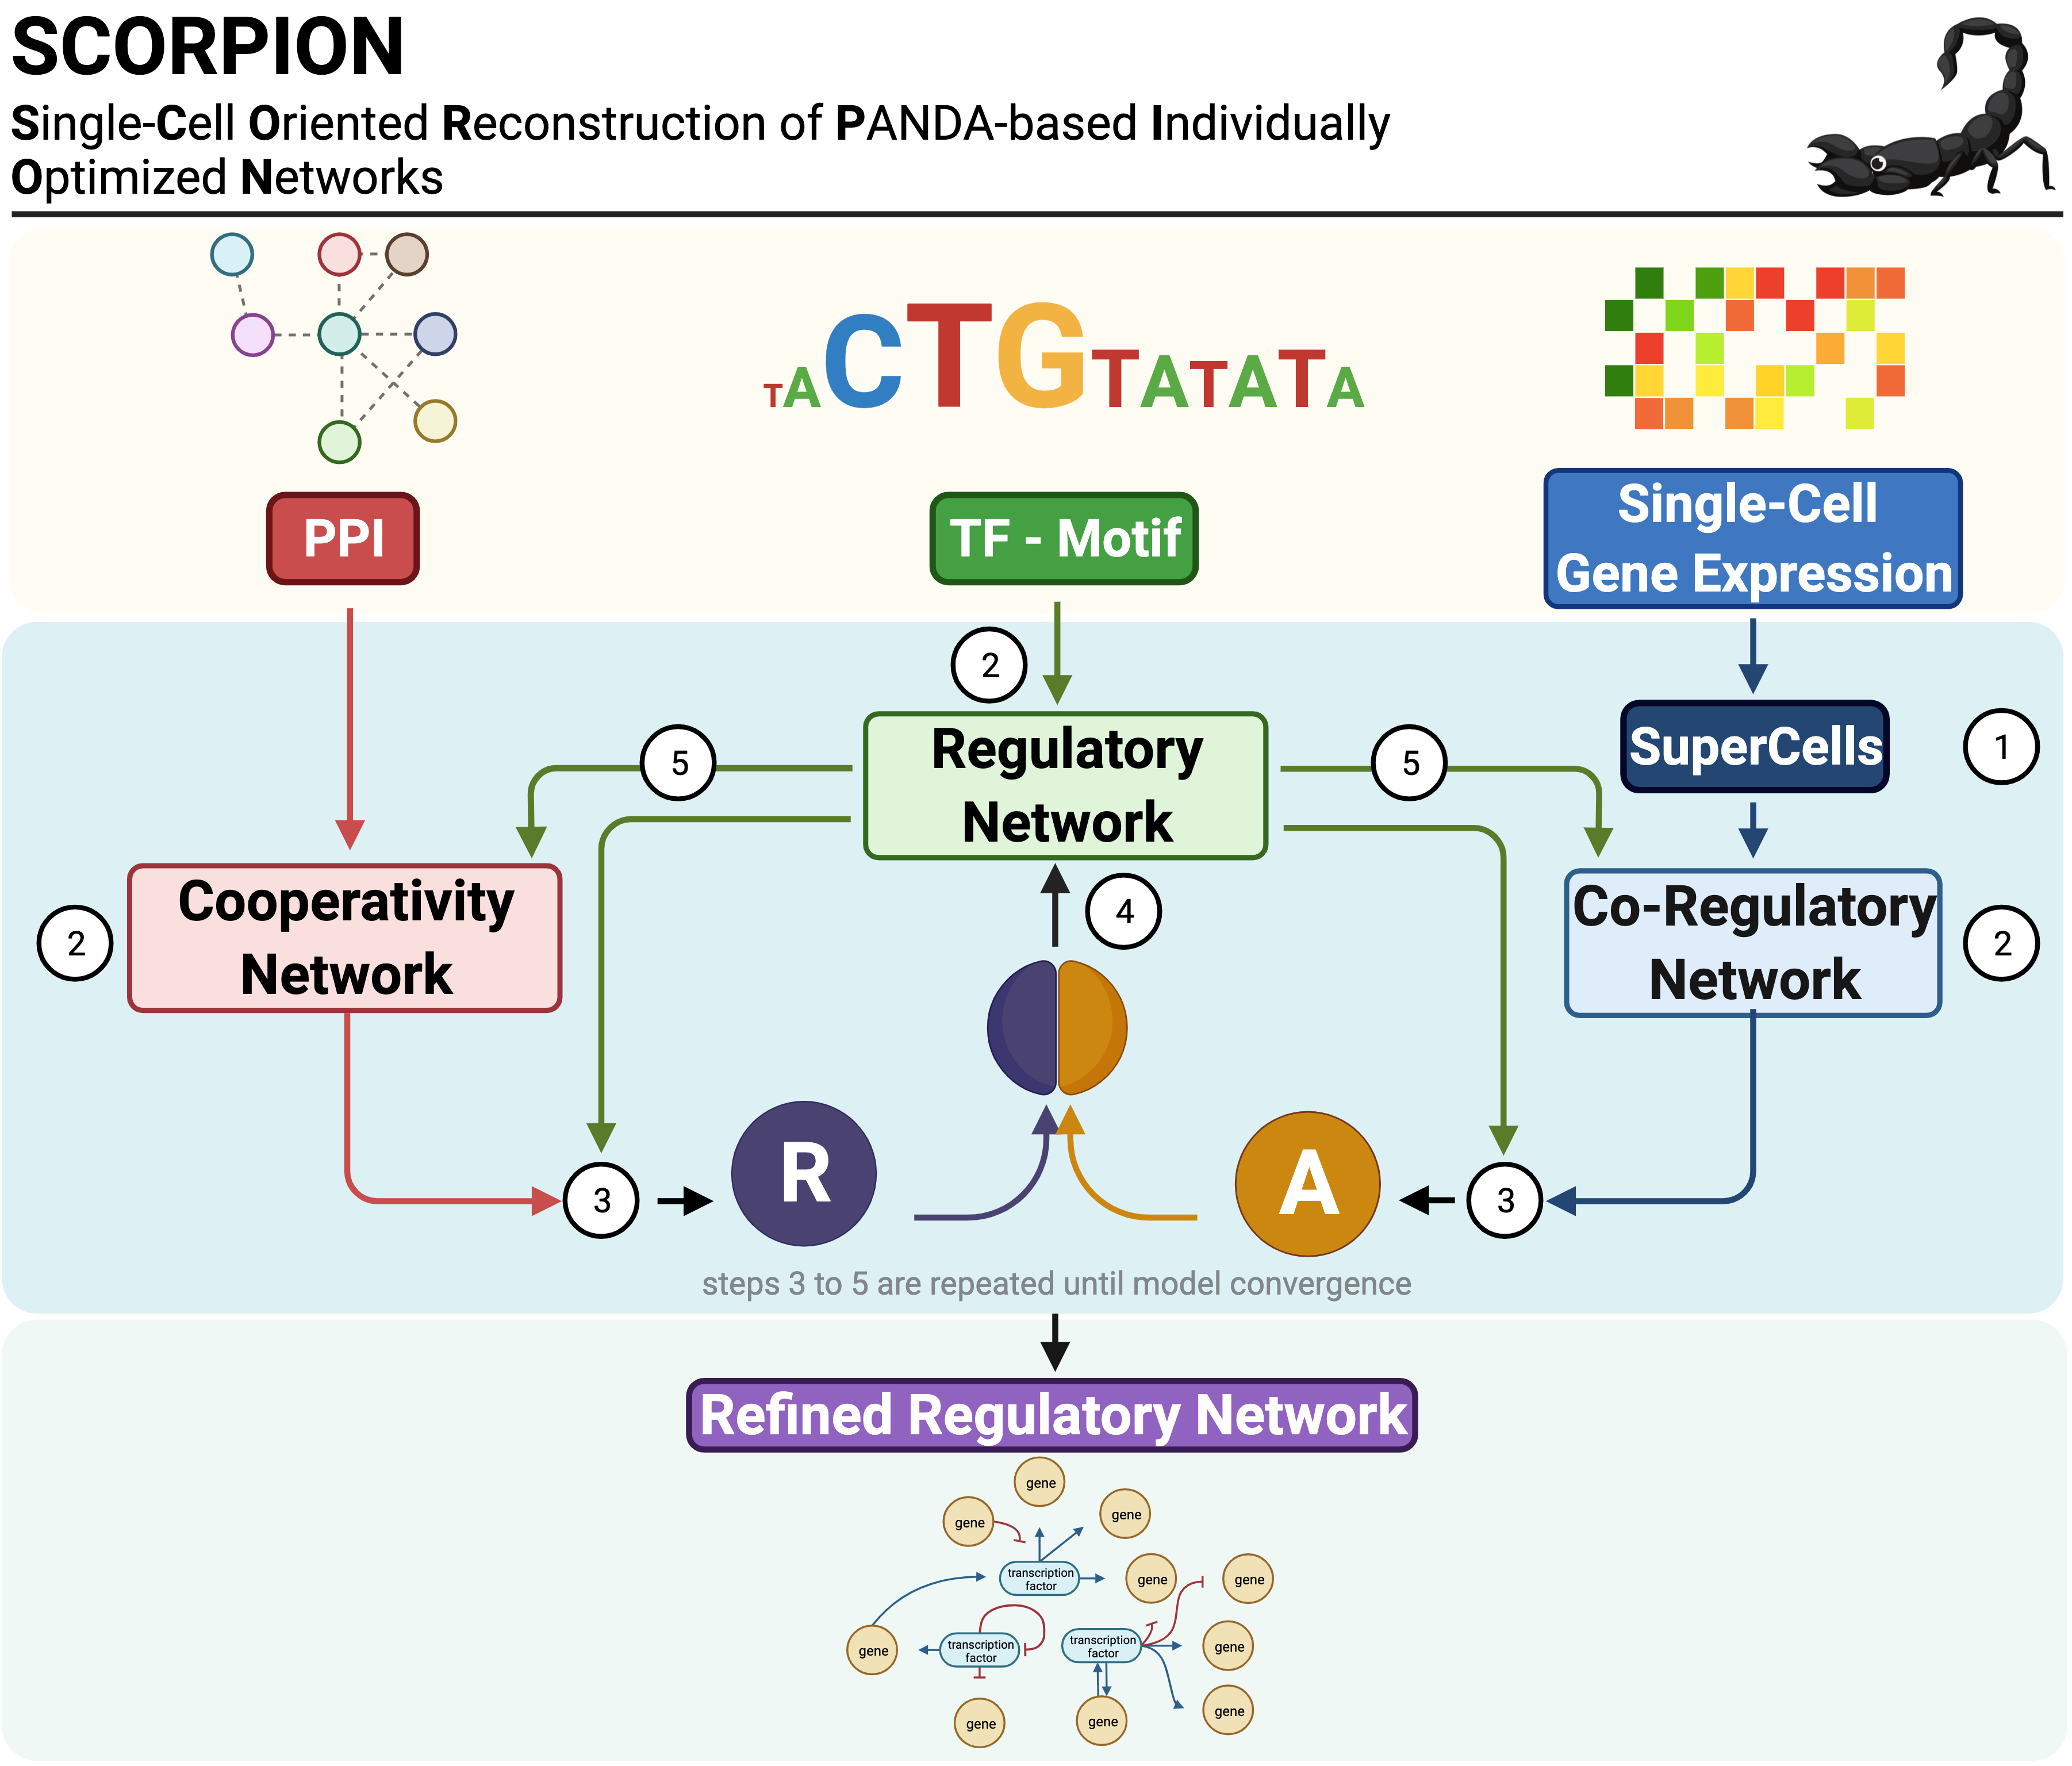
SCORPION (Single-Cell Oriented Reconstruction of PANDA Individually Optimized Gene Regulatory Networks), is an R package that uses coarse-graining of single-cell/nuclei RNA-seq data to reduce sparsity and improve the ability to detect the gene regulatory network's underlying correlation structure. The coarse-grained data generated is then used to reconstruct the gene regulatory network using a network refinement strategy through the PANDA (Passing Attributes between Networks for Data Assimilation) message passing algorithm. This algorithm is designed to integrate multiple sources of information such as protein-protein interaction, gene expression, and sequence motif data to predict accurate regulatory relationships. Thanks to the use of the same baseline priors in each instance, this approach can reconstruct comparable, fully-connected, weighted, and directed transcriptome-wide single-cell gene regulatory networks suitable for use in population-level studies.
SCORPION is available through the CRAN repositories, you can install and load it, using the following command:
install.packages('SCORPION')
library(SCORPION)
We provide an example dataset (formally a list) containing three objects. The motif data.frame describes a set of pairwise connections where a specific known sequence motif of a transcription factor was found upstream of the corresponding gene. For this particular example, the data is a subset of the transcription-factor and target gene pairs provided by the dorothea package for Homo sapiens. The expression dgCMatrix is a set of 230 gene expression levels measured across 80 PBMC cells provided by the Seurat package as pbmc_small. Finally, the ppi data.frame describes a set of known pairwise protein-protein interactions.
data(scorpionTest)
The structure of the data can be accessed as follows:
str(scorpionTest)

# List of 3
# $ gex:Formal class 'dgCMatrix' [package "Matrix"] with 6 slots
# .. ..@ i       : int [1:4456] 1 5 8 11 22 30 33 34 36 38 ...
# .. ..@ p       : int [1:81] 0 47 99 149 205 258 306 342 387 423 ...
# .. ..@ Dim     : int [1:2] 230 80
# .. ..@ Dimnames:List of 2
# .. .. ..$ : chr [1:230] "MS4A1" "CD79B" "CD79A" "HLA-DRA" ...
# .. .. ..$ : chr [1:80] "ATGCCAGAACGACT" "CATGGCCTGTGCAT" "GAACCTGATGAACC" "TGACTGGATTCTCA" ...
# .. ..@ x       : num [1:4456] 1 1 3 1 1 4 1 5 1 1 ...
# .. ..@ factors : list()
# $ tf :'data.frame':	4485 obs. of  3 variables:
#   ..$ tf    : chr [1:4485] "ADNP" "ADNP" "ADNP" "AEBP2" ...
# ..$ target: chr [1:4485] "PRF1" "TMEM40" "TNFRSF1B" "CFP" ...
# ..$ mor   : num [1:4485] 1 1 1 1 1 1 1 1 1 1 ...
# $ ppi:'data.frame':	12754 obs. of  3 variables:
#   ..$ X.node1       : chr [1:12754] "ADNP" "ADNP" "ADNP" "AEBP2" ...
# ..$ node2         : chr [1:12754] "ZBTB14" "NFIA" "CDC5L" "YY1" ...
# ..$ combined_score: num [1:12754] 0.769 0.64 0.581 0.597 0.54 0.753 0.659 0.548 0.59 0.654 ...
Here, we are running SCORPION with large alphaValue = 0.8 for testing purposes. The default value of the alphaValue is 0.1.
scorpionOutput <- scorpion(tfMotifs = scorpionTest$tf,
                           gexMatrix = scorpionTest$gex,
                           ppiNet = scorpionTest$ppi,
                           alphaValue = 0.8)
# ── SCORPION ────────────────────────────────────────────────────────────────
# ✔ Initializing and validating
# ✔ Verified sufficient samples
# ℹ Normalizing networks
# ℹ Learning Network
# ℹ Using tanimoto similarity
# ✔ Successfully ran SCORPION on 214 Genes and 783 TFs
# ℹ Time elapsed: 2.72 seconds
The structure of the output can be accessed as follows:
str(scorpionOutput)

# List of 6
# $ regNet  :Formal class 'dgeMatrix' [package "Matrix"] with 4 slots
# .. ..@ x       : num [1:167562] -0.413 1.517 -1.311 0.364 -1.041 ...
# .. ..@ Dim     : int [1:2] 783 214
# .. ..@ Dimnames:List of 2
# .. .. ..$ : chr [1:783] "ADNP" "AEBP2" "AIRE" "ALX1" ...
# .. .. ..$ : chr [1:214] "ACAP1" "ACRBP" "ACSM3" "ADAR" ...
# .. ..@ factors : list()
# $ coregNet:Formal class 'dgeMatrix' [package "Matrix"] with 4 slots
# .. ..@ x       : num [1:45796] 7.07e+06 -4.06 1.76e+01 -1.16e+01 -1.62e+01 ...
# .. ..@ Dim     : int [1:2] 214 214
# .. ..@ Dimnames:List of 2
# .. .. ..$ : chr [1:214] "ACAP1" "ACRBP" "ACSM3" "ADAR" ...
# .. .. ..$ : chr [1:214] "ACAP1" "ACRBP" "ACSM3" "ADAR" ...
# .. ..@ factors : list()
# $ coopNet :Formal class 'dgeMatrix' [package "Matrix"] with 4 slots
# .. ..@ x       : num [1:613089] 5.65e+06 -5.16 -3.79 -3.63 2.94 ...
# .. ..@ Dim     : int [1:2] 783 783
# .. ..@ Dimnames:List of 2
# .. .. ..$ : chr [1:783] "ADNP" "AEBP2" "AIRE" "ALX1" ...
# .. .. ..$ : chr [1:783] "ADNP" "AEBP2" "AIRE" "ALX1" ...
# .. ..@ factors : list()
# $ numGenes: int 214
# $ numTFs  : int 783
# $ numEdges: int 167562
Please cite: Osorio, D., Capasso, A., Eckhardt, S. G., Giri, U., Somma, A., Pitts, T. M., ... & Kuijjer, M. L. (2023). Population-level comparisons of gene regulatory networks modeled on high-throughput single-cell transcriptomics data. bioRxiv, 2023-01.
For the supplementary information of Population-level comparisons of gene regulatory networks modeled on high-throughput single-cell transcriptomics data. Please visit: SCORPION Supplementary Information
