This repo will grow into a collection of Python libraries for XOR arithmetic, as well as apps for analyzing and visualizing Kademlia DHT routing logs.
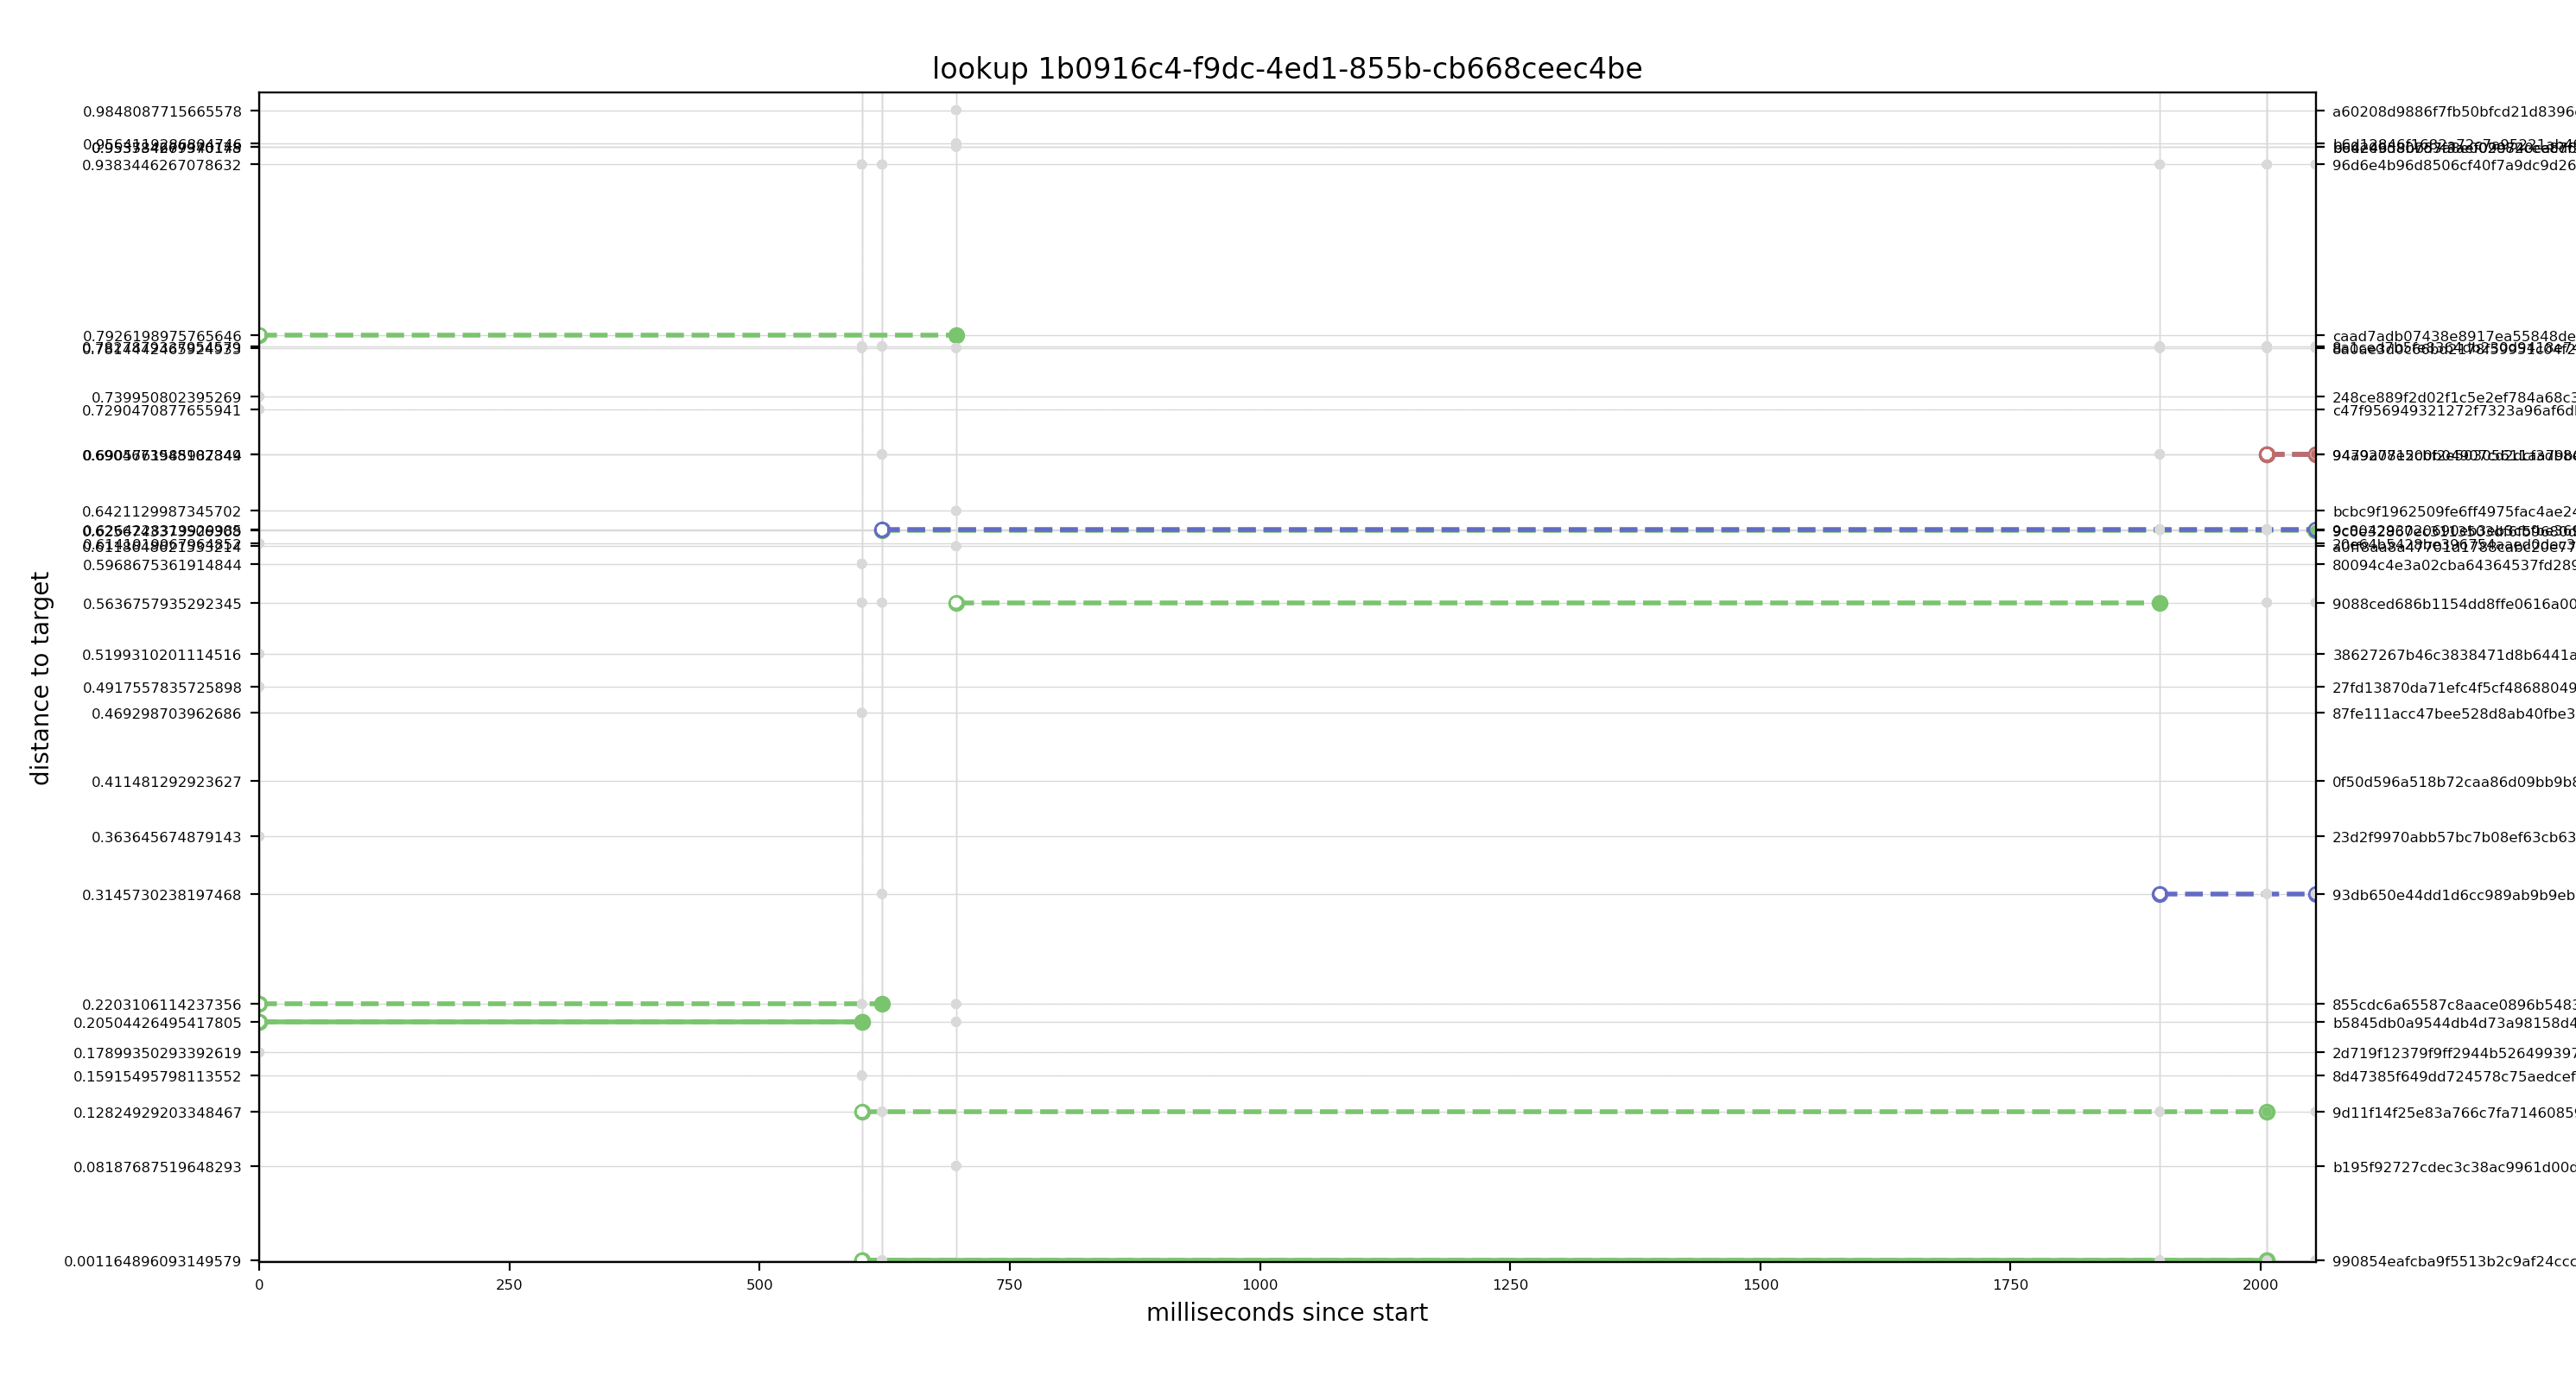
The "show lookup" command-line tool visualizes a lookup execution. To invoke it, from the root directory of this repo, run:
python -m tool showlookup --id=LOOKUP_ID DHT_LOOKUPS_LOG_FILENAME
You should see something like:
How to read this:
- The X-axis represents time, measured in milliseconds since the start of the lookup
- The Y-axis represents peers by their distance to the lookup target. The left Y-axis shows distance to target, while the right Y-axis shows peer XOR keys
- Grey horizontal grid lines indicate the peers that were encountered throughout the lookup
- Grey vertical grid lines indicate lookup events
- Thick horizontal lines represent queries:
- Green queries are successful. When a query succeeds, the peers it delivers are represented as small grey discs along the vertical grid line, corresponding to the query's end.
- Red queries are unsuccessful
- Blue queries did not complete and were aborted by the lookup's termination
- Solid green queries are successful queries that form a start-to-finish lookup path
Contributions welcome. Please check out the issues.
Check out our contributing document for more information on how we work, and about contributing in general. Please be aware that all interactions related to libp2p are subject to the IPFS Code of Conduct.
MIT © Protocol Labs Inc.
