kplot is an open source Cairo plotting library. This is the README file for display with GitHub, which hosts a read-only source repository of the project. To keep up to date with the current stable release of kplot, visit the kplot website.
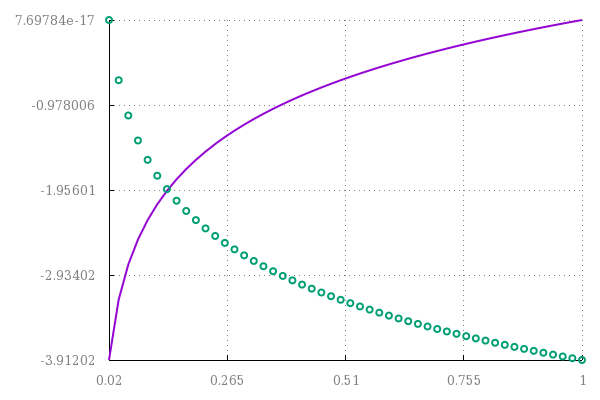
Interfacing with kplot is fairly easy. One creates a data source and a plot, fills the data source with points, connects the source to the plot, the plots. The data source can have its values changed, the plot can be re-plotted, etc.
The above graph is created by the following. Note that there is little error-checking!
#include <cairo.h>
#include <math.h>
#include <stdio.h>
#include <stdlib.h>
#include <kplot.h>

int
main(void)
{
	struct kpair	 points1[50], points2[50];
	struct kdata	*d1, *d2;
	struct kplot	*p;
	cairo_surface_t	*surf;
	size_t		 i;
	cairo_t		*cr;

	for (i = 0; i < 50; i++) {
		points1[i].x = points2[i].x = (i + 1) / 50.0;
		points1[i].y = log((i + 1) / 50.0);
		points2[i].y = -log((i + 1) / 50.0) + points1[0].y;
	}
	d1 = kdata_array_alloc(points1, 50);
	d2 = kdata_array_alloc(points2, 50);
	p = kplot_alloc(NULL);
	kplot_attach_data(p, d1, KPLOT_POINTS, NULL);
	kplot_attach_data(p, d2, KPLOT_LINES, NULL);
	kdata_destroy(d1);
	kdata_destroy(d2);
	surf = cairo_image_surface_create
		(CAIRO_FORMAT_ARGB32, 600, 400);
	cr = cairo_create(surf);
	cairo_surface_destroy(surf);
	kplot_draw(p, 600.0, 400.0, cr);
	cairo_surface_write_to_png
		(cairo_get_target(cr), "example0.png");
	cairo_destroy(cr);
	kplot_free(p);
	return(EXIT_SUCCESS);
}
kplot works out-of-the-box with modern UNIX systems with Cairo
installations.
Simply download the latest version's source
archive (or download
the project from GitHub), compile with make, then sudo make install.
See the kplot(3) manpage for complete library documentation.
All sources use the ISC (like OpenBSD) license. See the LICENSE.md file for details.
