This is a tool that I created during co-op because I was spending WAY too much money.
I didn't know where I was spending them, and all I got was a monthly bill saying I'm paying $X for the month of Y.
I was too lazy to manually check every transaction I made, and calculate them in my budget book.
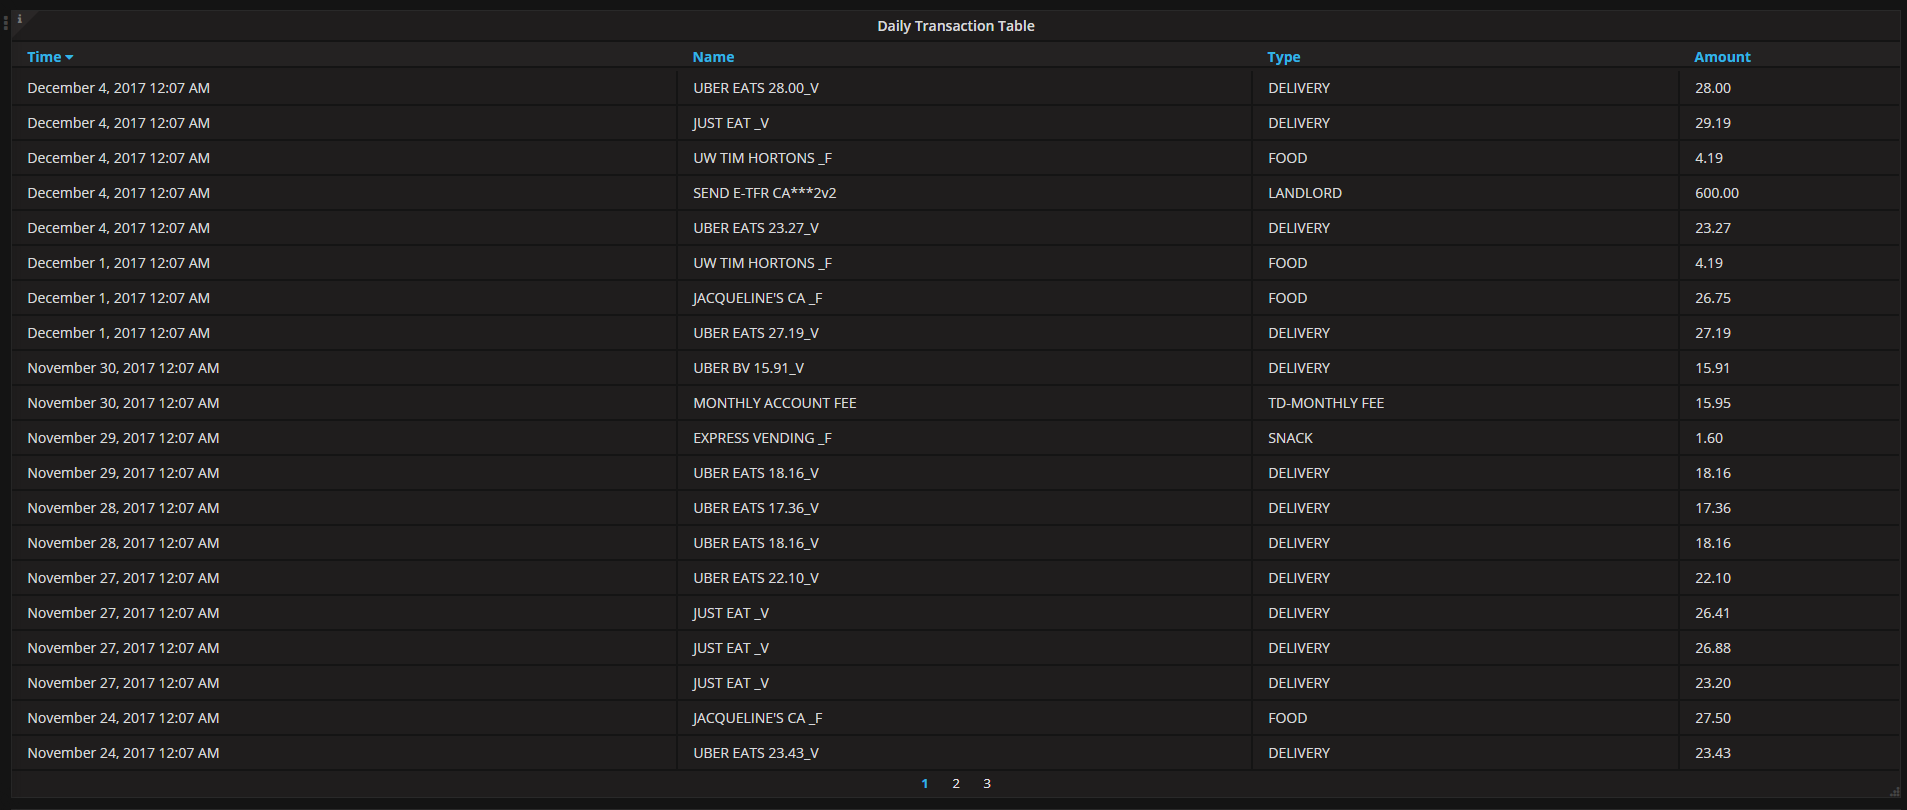
So I created this tool to automate the organization of these data and plot them to a graph/table so I can easily see the breakdown of my spendings.
If (for some reason), you want to use this tool as well, make sure you have Java, Grafana, influxDB installed.
Then run
mvn clean install
on the directory with pom.xml.
Then
cd target
java -jar SpendVisualize-1.0-SNAPSHOT-jar-with-dependencies.jar -ac [arg] -p [arg] -cp [arg]
You will also need a config file in this format
CompanyName1 = Type Of Company
CompanyName2 = Type Of Company
For example,
UberEats = Food
Cineplex = Entertainment
After you run the program, you will see something like:
Transaction data in Table (each transaction) :
Transaction data in Table (organized by type) :
Transaction data in Graph:
I can see that I spent around $1700 in just one month...
I really need to start spending more efficiently...


