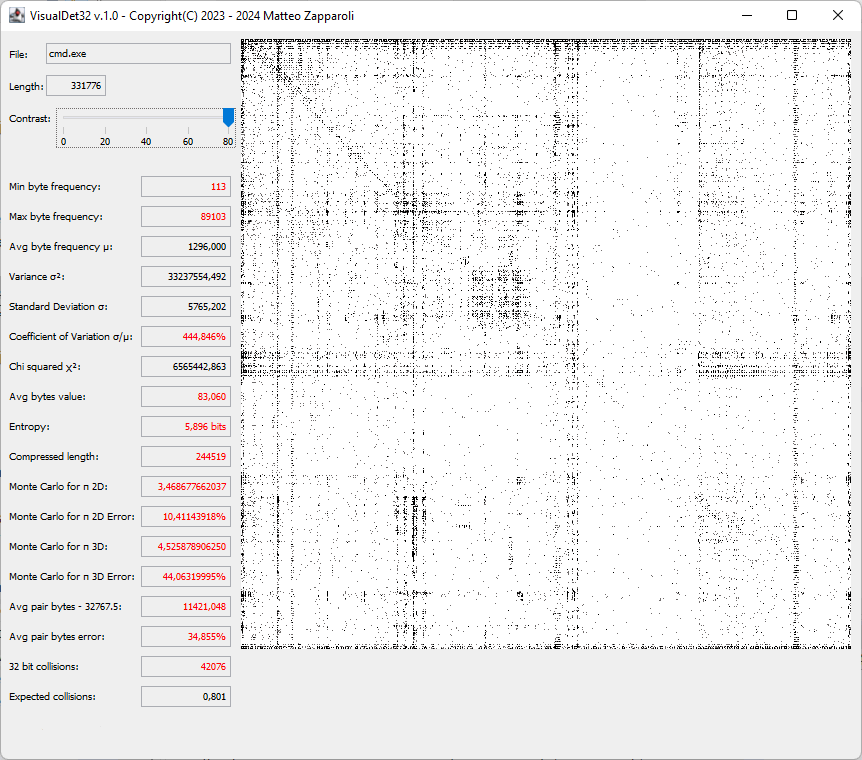
VisualRT is an advanced application designed to analyze the contents of a file by performing a series of statistical tests on the distribution of its bytes. It is used to evaluate the randomness or predictability of the file’s data, which can be useful in cryptography, compression analysis, and other fields where data distribution is important. It also allows you to view the "fingerprint" of the file, a sort of hash value in the form of a square image, where any patterns that could escape a statistical analysis emerge and helps establish the probability that the sequence is random or not.
VisualRT conducts a total of 14 tests, which are divided into two main categories: frequency-based tests that ignore byte positions and tests that depend on the distribution of bytes.
This group focuses on analyzing the frequency of byte occurrences within the data, without considering the order in which the bytes appear. These tests are designed to assess various statistical properties of the byte frequency. The tests in this group are:
- Minimum Frequency: This test measures the smallest frequency of any byte in the data, indicating which byte has the least occurrences.
- Maximum Frequency: This test calculates the highest frequency of any byte in the data, identifying the byte that appears the most frequently.
- Average Frequency μ: This is the mean frequency of all bytes, providing a general sense of how evenly bytes are distributed in the dataset.
- Variance σ2: This test calculates the variance of the byte frequencies, measuring the spread or dispersion of frequencies from their mean.
- Standard Deviation σ: The standard deviation is a common statistical measure that shows how much the byte frequencies deviate from the average frequency. It is the square root of the variance.
- Coefficient of Variation σ/μ: This is the ratio of the standard deviation to the mean frequency, providing a normalized measure of the dispersion relative to the average frequency.
- Chi-Square 𝛘2: This statistical test compares the observed byte frequencies to an expected uniform distribution, assessing whether the data deviates from randomness.
- Mean Byte Value (Sum): This test computes the sum of all byte values in the dataset, providing a raw measure of the average byte value. If the data are close to random, this should be about 127.5.
- Entropy: Entropy measures the randomness or uncertainty in the byte distribution. Higher entropy indicates a more random or uniform distribution of byte values.
- Estimated Compressed Size: This test estimates how compressible the data is, based on the byte frequency distribution, providing an indication of how much the data could potentially be reduced in size.
The second group of tests examines the actual distribution of bytes within the data, meaning that the relative positions and sequences of bytes are considered. These tests are more focused on patterns that arise from how the bytes are ordered. The tests in this group are:
- Pi Estimation Using Monte Carlo in 2D: One of the more intriguing tests in VisualRT is the estimation of π using the contents of the file. The file is interpreted as a series of 6-byte sequences, with the first 3 bytes used as the x-coordinate and the next 3 bytes as the y-coordinate on a 2D plane. The number of points that fall inside a unit circle (with radius 0xFFFFFF) is used to estimate π, drawing from Monte Carlo methods. The closer the estimate is to the true value of π, the more uniform the distribution of bytes in the file might be.
- Pi Estimation Using Monte Carlo in 3D: Similar to the 2D version, this test uses triplets of adjacent bytes to estimate π in three dimensions (sphere), adding an extra layer of complexity and accuracy to the π approximation.
- Mean of All Adjacent Byte Pairs: This test computes the mean value of every pair of adjacent bytes, providing insight into how consecutive byte values are related. For a file with a truly random byte distribution, the expected average should approach 32767.5, which is the midpoint of the possible 16-bit range. Deviations from this expected average can indicate non-random patterns or structured data, helping to assess the file's randomness level.
- Number of Collisions of 4-Byte Sequences: This test analyzes the file by dividing it into 4-byte sequences and counting how many times each sequence appears (collisions). Each 4-byte sequence is treated as a unique 32-bit value, with possible values ranging from 0 to 232-1. For a file with a completely random byte distribution, the expected number of collisions can be estimated using the birthday problem analogy. This test helps evaluate the randomness of the file. A number of collisions significantly different from the expected number could indicate non-random patterns or redundancy in the data, while a number of collisions close to the expected value suggests a higher degree of randomness.
If the results of the tests fall outside a threshold or range deemed appropriate for a uniform byte distribution, they are highlighted in red. This visual cue helps users quickly identify irregularities or deviations from expected randomness in the file's data.
In order to have a text version of the test results, VisualRT also prints the values to the standard output.
VisualRT also includes a graphical panel that provides a visual "fingerprint" of the file's byte content. This square panel, with adjustable dimensions limited by the screen size, displays the byte value distribution, offering a visual representation of potential patterns in the data. These patterns might indicate non-uniform distributions that could go unnoticed by statistical indices alone. Additionally, the panel includes a contrast adjustment feature, allowing users to amplify subtle, nearly imperceptible patterns, providing deeper insight into the structure of the file’s content.
Here are some examples of visual imprint of some file types, where the patterns are highlighted.
| File ASCII txt | File Windows EXE |
|---|---|
 |
 |
| Image PNG | Image JPG |
|---|---|
 |
 |
| File mp3 | File multi zip |
|---|---|
 |
 |
VisualRT provides a comprehensive suite of statistical and visual tools for analyzing the randomness and structure of a file's data. By combining traditional statistical measures (like variance and chi-square) with entropy calculations and even a unique approach to estimating π, it offers deep insights into the byte distribution, helping to evaluate the file’s compressibility, predictability, and overall randomness. Whether for cryptographic evaluation or data analysis, VisualRT is a powerful tool for assessing the underlying characteristics of any binary data.