

pyemcee is a Python implementation of the affine-invariant Markov chain Monte Carlo (MCMC) ensemble sampler, based on sl_emcee by M. A. Nowak, an S-Lang/ISIS implementation of the MCMC Hammer proposed by Goodman & Weare (2010), and also implemented in Python (emcee) by Foreman-Mackey et al. (2013).
To install the last version, all you should need to do is
$ python setup.py install
To install the stable version, you can use the preferred installer program (pip):
$ pip install pyemcee
or you can install it from the cross-platform package manager conda:
$ conda install -c conda-forge pyemcee
This package requires the following packages:
The Documentation of the functions provides in detail in the API Documentation (mcfit.github.io/pyemcee/doc). This Python library creates the MCMC sampling for given upper and lower uncertainties, and propagates uncertainties of parameters into the function.
See Jupyter Notebook: Notebook.ipynb
Run Jupyter Notebook on Binder:
First, you need to load the pyemcee library as follows:
import pyemcee
import numpy as np
You need to define your function. For example:
def myfunc21(input1):
   result1 = np.sum(input1)
   result2 = input1[1] ** input1[0]
   return [result1, result2]
Then, specify the upper and lower uncertainties of the prior parameters:
input1 = np.array([1., 2.])
input1_err = np.array([0.2, 0.5])
input1_err_p = input1_err
input1_err_m = -input1_err
output1 = myfunc21(input1)
output1_num = len(output1)
Choose the appropriate uncertainty distribution. For example, for a uniform distribution, use_gaussian=0, and a Gaussian distribution use_gaussian=1. Then, specify the number of walkers and the number of iterations, e.g. walk_num=30 and iteration_num=100. You can then create the MCMC sample and propagate the uncertainties of the input parameters into your defined functions as follows:
use_gaussian=0 # uniform distribution from min value to max value
walk_num=30 # number of walkers
iteration_num=100 # number of samplers
mcmc_sim = pyemcee.hammer(myfunc21, input1, input1_err_m,
                          input1_err_p, output1, walk_num,
                          iteration_num, use_gaussian)
To determine the upper and lower errors of the function outputs, you need to run with the chosen appropriate confidence level. For example, a 1.645-sigma standard deviation can be specified with clevel=0.90. For a 1-sigma standard deviation, we have clevel=0.682:
clevel=0.68268949 # 1-sigma
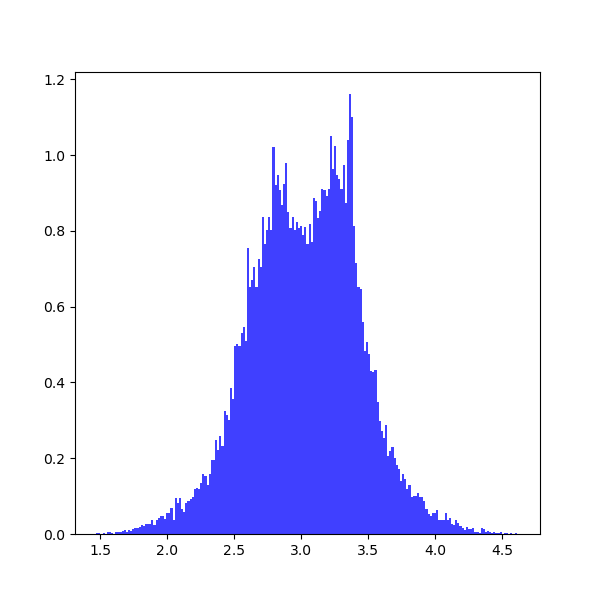
output1_error = pyemcee.find_errors(output1, mcmc_sim, clevel, do_plot=1)
which shows the following distribution histograms:
To prevent plotting, you should set do_plot=None. To print the results:
for i in range(0, output1_num):
   print(output1[i], output1_error[i,:])
which provide the upper and lower limits on each parameter:
3.0 [-0.35801017 0.35998471]
2.0 [-0.37573196 0.36297235]
For other standard deviation, you should use different confidence levels:
clevel=0.38292492 # 0.5-sigma
clevel=0.68268949 # 1.0-sigma
clevel=0.86638560 # 1.5-sigma
clevel=0.90       # 1.645-sigma
clevel=0.95       # 1.960-sigma
clevel=0.95449974 # 2.0-sigma
clevel=0.98758067 # 2.5-sigma
clevel=0.99       # 2.575-sigma
clevel=0.99730020 # 3.0-sigma
clevel=0.99953474 # 3.5-sigma
clevel=0.99993666 # 4.0-sigma
clevel=0.99999320 # 4.5-sigma
clevel=0.99999943 # 5.0-sigma
clevel=0.99999996 # 5.5-sigma
clevel=0.999999998# 6.0-sigmaFor more information on how to use the API functions from the pyemcee library, please read the API Documentation published on mcfit.github.io/pyemcee.
| Documentation | https://pyemcee.readthedocs.io/ |
| Repository | https://github.com/mcfit/pyemcee |
| Issues & Ideas | https://github.com/mcfit/pyemcee/issues |
| Conda-Forge | https://anaconda.org/conda-forge/pyemcee |
| PyPI | https://pypi.org/project/pyemcee/ |
| Archive | 10.5281/zenodo.4495911 |


