
Python package to generate plots from coverage report
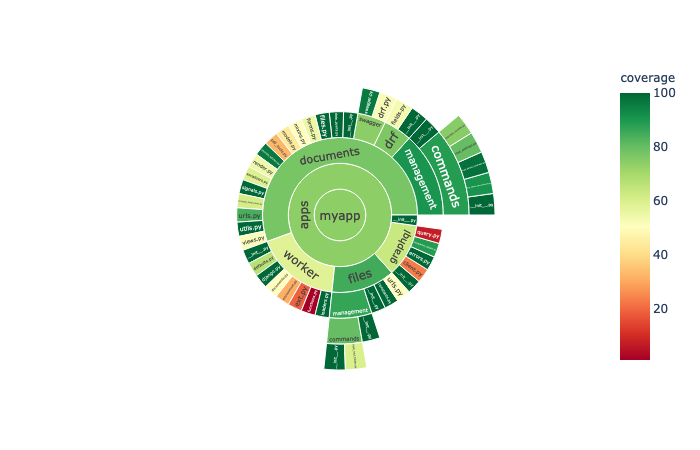
Generate visual plots to demonstrate your code coverage. Interactive plots are opened in the browser immediately after running the script. HTML files for the plots are stored alongside the coverage report inside htmlcov folder.
Plots are generated using plotly express.
- Install using pip install plot-coverage
- From the project root (where htmlcov folder is located), run:
- plot_coverage --plot=treemap
- plot_coverage --plot=sunburst
Note: Make sure htmlcov/index.html is present at the root of your project before running the above. So, coverage html should be run before attempting this.
- Generate Treemap plot for showing your coverage report with color sequence based on coverage percentage.
- Generate Sunburst plot for showing your coverage report with color sequence based on coverage percentage.
This package was created with Cookiecutter and the audreyr/cookiecutter-pypackage project template.
- Free software: BSD license

