-
-
Notifications
You must be signed in to change notification settings - Fork 1.5k
Glances 3.0 Release Note

The simple way to install Glances on your system:
pip install glances
And to upgrade it (from a previous Glances version installed with pip):
pip install --upgrade glances
Note: See the installation manual for others installation methods.
- Support for Python 3.3 has been removed (yes Glances is still compatible with Python 2.7)
- Support for PsUtil < 5.3 has been removed
- XML/RPC API have changed between Glances 2 and Glances 3. It is not possible to use a Glances 2.x client with a Glances 3.x server and conversely
- Restful API upgraded to version 3 (default entry point: http://localhost:61208/api/3)
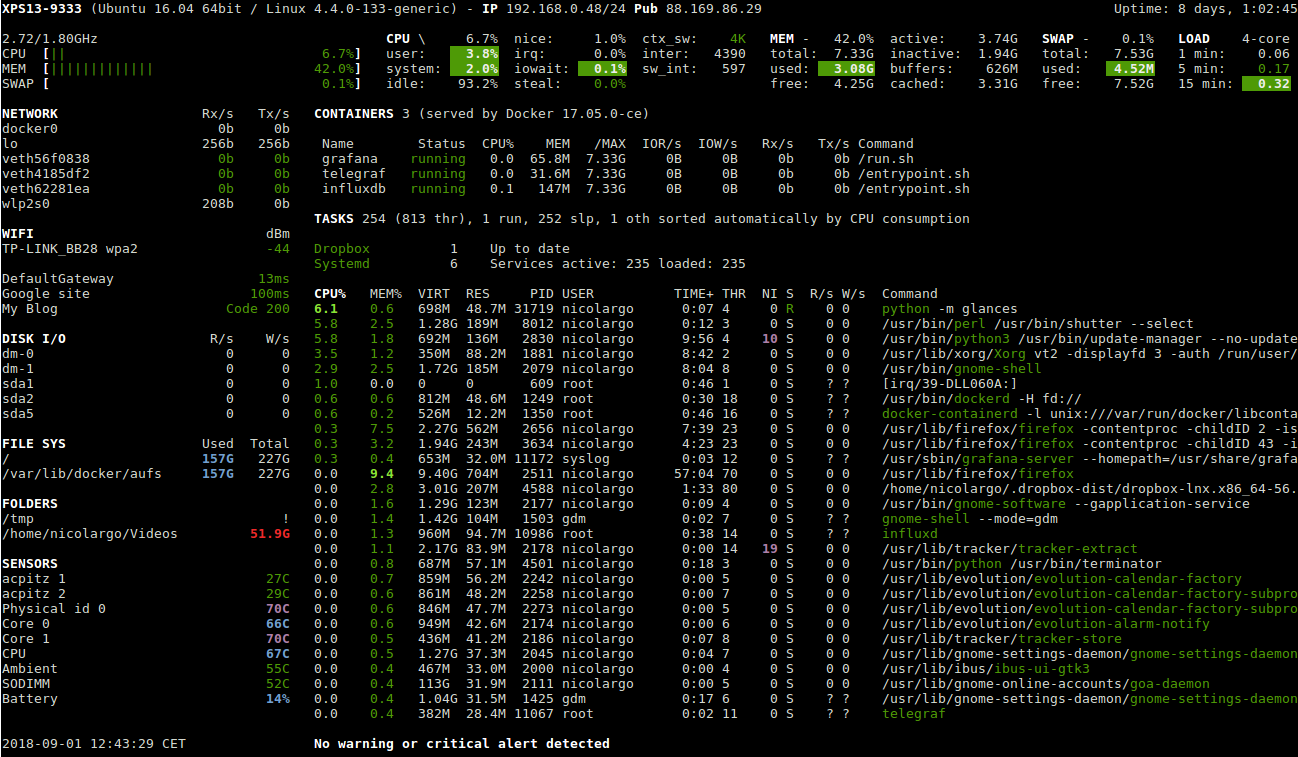
A new stat is available for all displayed processes: thread count.

It is now possible to run the Restful API without the Web User Interface (UI) using the --disable-webui option.
Web UI and API (default Web server mode):
$ glances -w
Glances Web User Interface started on http://0.0.0.0:61208/
Web API without UI:
$ glances -w --disable-webui
Glances Restful API Server started on http://0.0.0.0:61208/api/3/
The export module has been completely refactor and the Matplotlib graph generation lib replaced by Pygal. You can generate dynamic graphs (SVG format) in a target folder. The generation starts every time the 'g' hotkey is pressed in the CLI interface or every 'generate_every' seconds (see the configuration key in the glances.conf file).
Example og graph section in the glances.conf file:
[graph]
# Configuration for the --export graph option
# Set the path where the graph (.svg files) will be created
# Can be overwrite by the --graph-path command line option
path=/tmp
# It is possible to generate the graphs automatically by setting the
# generate_every to a non zero value corresponding to the seconds between
# two generation. Set it to 0 to disable graph auto generation.
generate_every=60
# See followings configuration keys definitions in the Pygal lib documentation
# http://pygal.org/en/stable/documentation/index.html
width=800
height=600
style=DarkStyle
and run Glances with:
$ glances --export graph
Example of output (load graph)
Note: SVG files can be openned in every modern Web Browser.
A new configuration key has been added in the Glances configuration file (default value is False).
Set it to True to display all the containers:
[docker]
# By default, Glances only display running containers
# Set the following key to True to display all containers
all=True
Result in the curses interface:

Add the possibility to use system call in the Glances configuration file sections.
Note: the system call is evaluate when the Glances configuration file is read.
Example to add a tag with the hostname in an InfluxDB export section:
[influxdb]
prefix=`hostname`
tags=foo:bar,spam:eggs,system:`uname -a`
In Glances < 3.0, if you want to disable one or more plugin you should enter the following command line:
$ glances --disable-network --disable-load
With Glances 3.0 and higher it is replaced by:
$ glances --disable-plugin network,load
The new syntax will bring some dynamic function for the developer when a new plugin is added.
Same kind of call should be done for the export module (--export).
A new --modules-list option should be available to display the plugins and exports module:
$ glances --modules-list
Plugins list: load, docker, help, ip, memswap, processlist, cloud, uptime, network, percpu, irq, system, diskio, gpu, folders, core, fs, raid, mem, alert, psutilversion, hddtemp, sensors, now, quicklook, wifi, cpu, processcount, amps, batpercent, ports
Exporters list: statsd, riemann, couchdb, prometheus, rabbitmq, kafka, json, elasticsearch, influxdb, opentsdb, zeromq, csv, restful, cassandra
A new light mode is available in the curse interface.
$ glances --light

Implement configuration threshold for 'nice' values. Define color levels using a comma separated list of 'nice' values for nice_careful, nice_warning and/or nice_critical. The list may contain negative, positive or zero values.
[processlist]
# Nice priorities range from -20 to 19.
# Configure nice levels using a comma separated list.
#
# Nice: Example 1, non-zero is warning (default behavior)
nice_warning=-20,-19,-18,-17,-16,-15,-14,-13,-12,-11,-10,-9,-8,-7,-6,-5,-4,-3,-2,-1,1,2,3,4,5,6,7,8,9,10,11,12,13,14,15,16,17,18,19
#
# Nice: Example 2, low priority processes escalate from careful to critical
#nice_careful=1,2,3,4,5,6,7,8,9
#nice_warning=10,11,12,13,14
#nice_critical=15,16,17,18,19
A new output module is available in order to display RAWJson stats to standard output (stdout).
Note: It will display one line per stat per refresh.
Examples:
$ glances --stdout cpu
cpu: {'softirq': 0.0, 'iowait': 0.0, 'interrupts': 852, 'system': 0.9, 'guest': 0.0, 'soft_interrupts': 1091, 'time_since_update': 3.0178308486938477, 'idle': 96.0, 'user': 2.8, 'guest_nice': 0.0, 'irq': 0.0, 'cpucore': 4, 'syscalls': 0, 'total': 6.4, 'steal': 0.0, 'ctx_switches': 2613, 'nice': 0.3}
cpu: {'softirq': 0.0, 'iowait': 0.1, 'interrupts': 761, 'system': 1.2, 'guest': 0.0, 'soft_interrupts': 1078, 'time_since_update': 3.00667405128479, 'idle': 96.2, 'user': 2.3, 'guest_nice': 0.0, 'irq': 0.0, 'cpucore': 4, 'syscalls': 0, 'total': 3.7, 'steal': 0.0, 'ctx_switches': 3753, 'nice': 0.3}
cpu: {'softirq': 0.0, 'iowait': 0.1, 'interrupts': 1000, 'system': 1.6, 'guest': 0.0, 'soft_interrupts': 1218, 'time_since_update': 2.9971659183502197, 'idle': 95.2, 'user': 2.8, 'guest_nice': 0.0, 'irq': 0.0, 'cpucore': 4, 'syscalls': 0, 'total': 4.8, 'steal': 0.0, 'ctx_switches': 4033, 'nice': 0.4}

$ glances --stdout cpu.user
cpu.user: 2.8
cpu.user: 4.3
cpu.user: 3.3

$ glances --stdout cpu.user,mem
mem: {'available': 4057534464, 'used': 3814420480, 'cached': 3555233792, 'percent': 48.5, 'free': 4057534464, 'inactive': 1829580800, 'active': 4756611072, 'shared': 396623872, 'total': 7871954944, 'buffers': 618676224}
cpu.user: 3.0
mem: {'available': 4057026560, 'used': 3814928384, 'cached': 3555233792, 'percent': 48.5, 'free': 4057026560, 'inactive': 1829576704, 'active': 4756856832, 'shared': 396623872, 'total': 7871954944, 'buffers': 618684416}
cpu.user: 2.9
mem: {'available': 4055138304, 'used': 3816816640, 'cached': 3555241984, 'percent': 48.5, 'free': 4055138304, 'inactive': 1829580800, 'active': 4758806528, 'shared': 396623872, 'total': 7871954944, 'buffers': 618684416}
You can export statistics to an MQTT server.
The connection should be defined in the Glances configuration file as following:
[mqtt]
host=localhost
port=883
user=glances
password=glances
topic=glances
and run Glances with:
$ glances --export mqtt
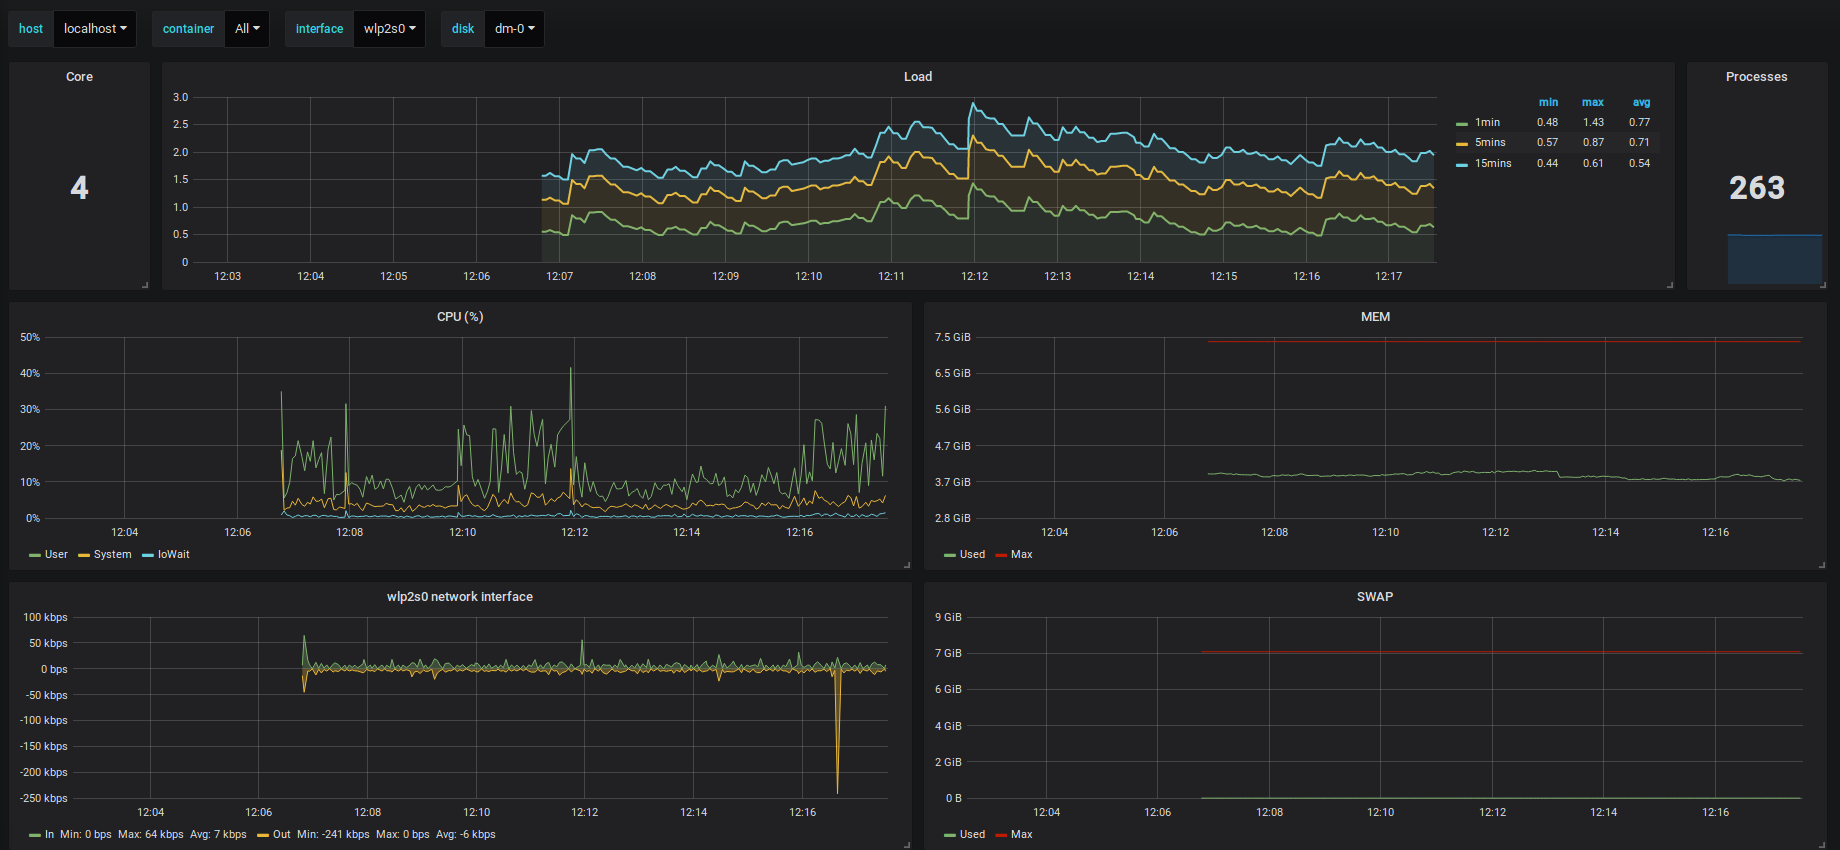
A new Grafana dashboard is available with stats about running containers, network interface and much more !

And also...
- Make the left side bar width dynamic in the Curse UI #1177
- Add deflate compression support to the RestAPI (and support in the WebUI) #1182
- Add context switches bottleneck identification #1212
- Add labels support to Promotheus exporter #1255
- Huge refactor of the WebUI packaging (based on Yarn and WebPack) thanks to @spike008t #1239
- Refactor the InfluxDB exporter (API is now stable) #1166
- Add a code of conduct for Glances project's participants #1211
- Take advantage of the psutil issue #1025 (Add process_iter(attrs, ad_value)) #1105
- Display debug message if dep lib is not found #1224
- Add time zone to the current time #1249
- Use HTTPs URLs to check public IP address #1253
- Overlap in Web UI when monitoring a machine with 16 cpu threads #1265
- Crash in the Wifi plugin on my Laptop #1151
- Failed to connect to bus: No such file or directory #1156
- glances_plugin.py has a problem with specific docker output #1160
- Key error 'address' in the IP plugin #1176
- NameError: name 'mode' is not defined in case of interrupt shortly after starting the server mode #1175
- Crash on startup: KeyError: 'hz_actual_raw' on Raspbian 9.1 #1170
- Add missing mount-observe and system-observe interfaces #1179
- OS specific arguments should be documented and reported #1180
- 'ascii' codec can't encode character u'\U0001f4a9' in position 4: ordinal not in range(128) #1185
- KeyError: 'memory_info' on stats sum #1188
- Electron/Atom processes displayed wrong in process list #1192
- Another encoding issue... With both Python 2 and Python 3 #1197
- Glances do not exit when eating 'q' #1207
- FreeBSD blackhole bug #1202
- Glances crashes when mountpoint with non ASCII characters exists #1201
- [WEB UI] Minor issue on the Web UI #1240
- [Glances 3.0 RC1] Client/Server is broken #1244
- Fixing horizontal scrolling #1248
- Stats updated during export (thread issue) #1250
- Glances --browser crashed when more than 40 glances servers on screen 78x45 #1256
- OSX - Python 3 and empty percent and res #1251
- Crashes when influxdb option set #1260
- AMP for kernel process is not working #1261
- Arch linux package (2.11.1-2) psutil (v5.4.1): RuntimeWarning: ignoring OSError #1203
- Glances crash with extended process stats #1283
- Terminal window stuck at the last accessed protected server #1275
- Glances shows mdadm RAID0 as degraded when chunksize=128k and the array isn't degraded. #1299
- Never starts in a server on Google Cloud and FreeBSD #1292