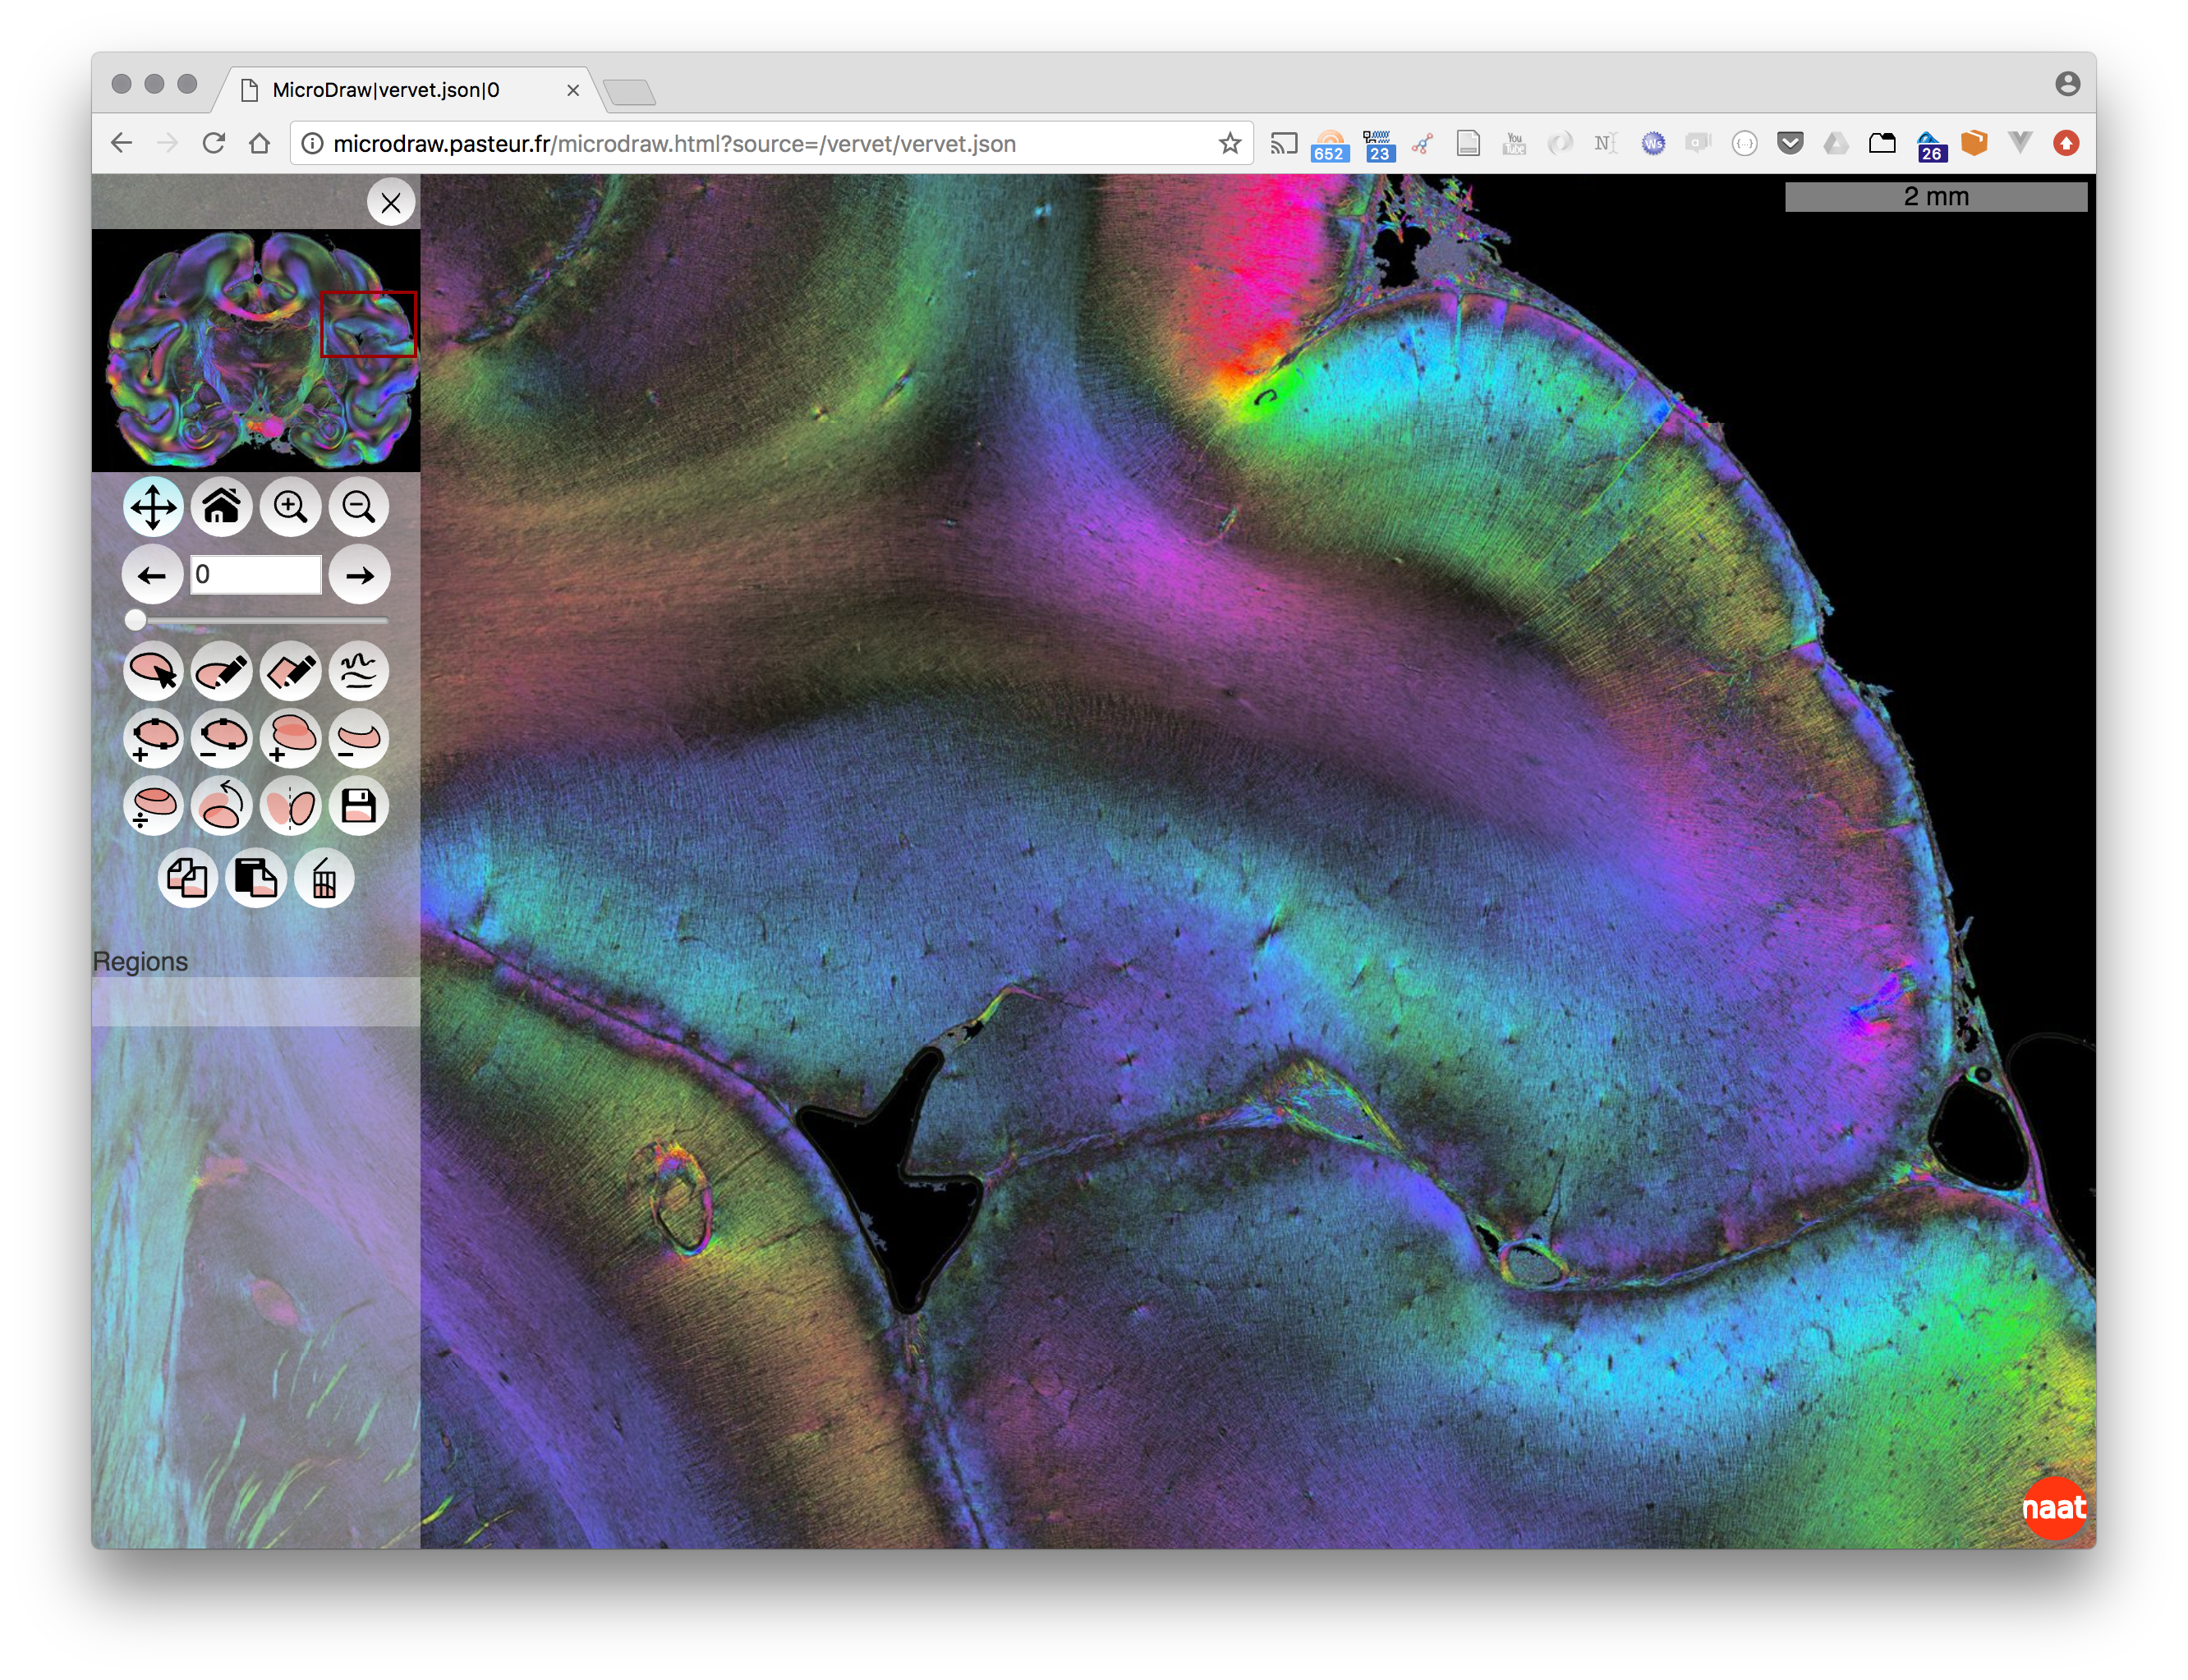
MicroDraw is a collaborative vectorial annotation tool for ultra high resolution data, such as that produced by high-throughput histology.
Data visualisation uses OpenSeadragon, and data annotation uses Paper.js.
as of 2017-08-15
-
install nodejs
-
install mongo
-
checkout the repository
git clone https://github.com/r03ert0/microdraw.git -
cd microdraw -
rename and adjust configuration example files
github-keys.json.example -> github-keys.json- Get your Github developer keys for your local microdraw url
- go to
https://github.com/settings/applications/newand add a new application - App name: MicroDraw development for example
- Homepage URL: http://localhost:3000
- Authorization callback URL: http://localhost:3000/auth/github/callback
- copy paste client id, client secret and callback URL into
github-keys.json
- go to
- Get your Github developer keys for your local microdraw url
public/js/base.js.example -> public/js/base.js(default should bevar localhost = "http://localhost:3000";)public/js/configuration.json.example -> public/js/configuration.jsonset database to true
-
install the project
- cd into microdraw
npm install
-
run the project
- in one terminal window start
mongodatabase and typeuse microdrawto switch to the MicroDraw database and leave it run - in another terminal: cd into microdraw folder:
npm start
- in one terminal window start
-
open http://localhost:3000 to see MicroDraws landing page and click any of the data links provided
-
test data can be viewed at http://localhost:3000/data?source=/test_data/cat.json
- cd to /public directory, put yourDataFolder here which must contain
- a folder with the folders with your data tiles in dzi format
- the .dzi file containing the information about your data (generated by the converter)
- a json file containing information about your data in the following form: { "pixelsPerMeter": 1000000, "tileSources": [ "yourDataFolder/yourData.dzi" ] }
This project is licensed under GNU GPL v3 or any later version.
