Hidden Dimensions
Goal: Explore properties of Latent spaces to facilitate domain knowledge extraction in unsupervised/semi-supervised set-ups.
Data domains: Text and Image. Later on Graphs.
Applications:
- By discovering how to create Well-Clustered latent spaces, we can enable the extraction of Domain Constructs and Domain Concepts.
- Examples:
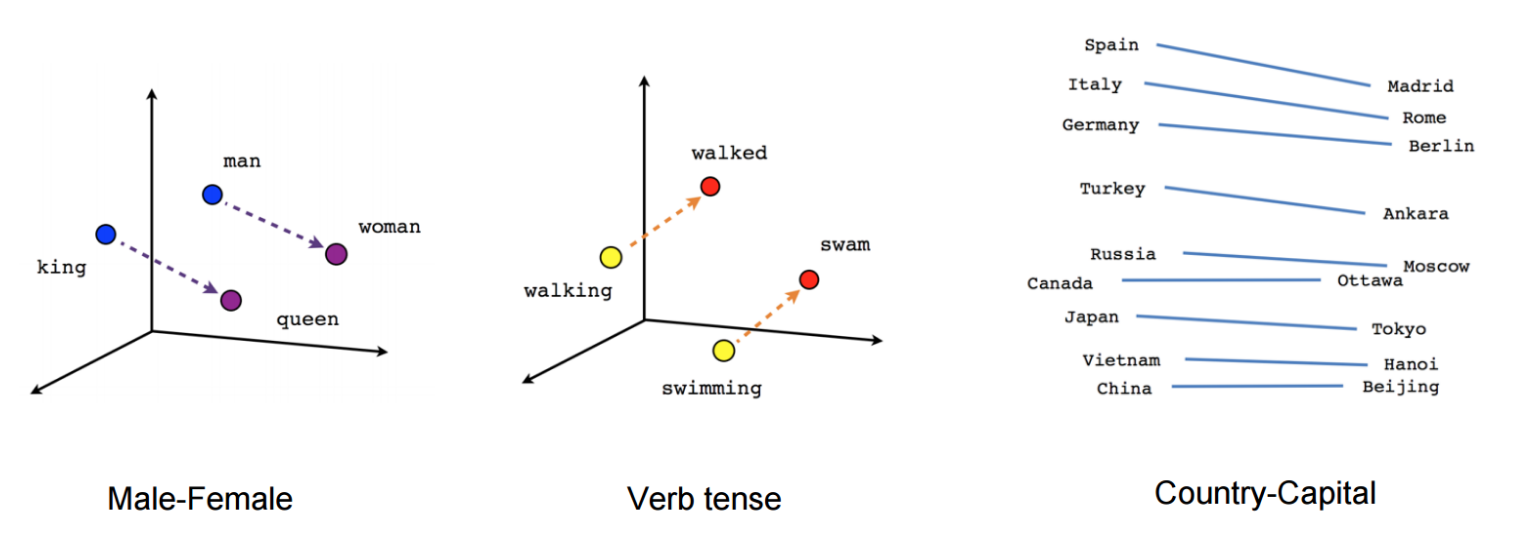
- Vector Directions in Word Embeddings
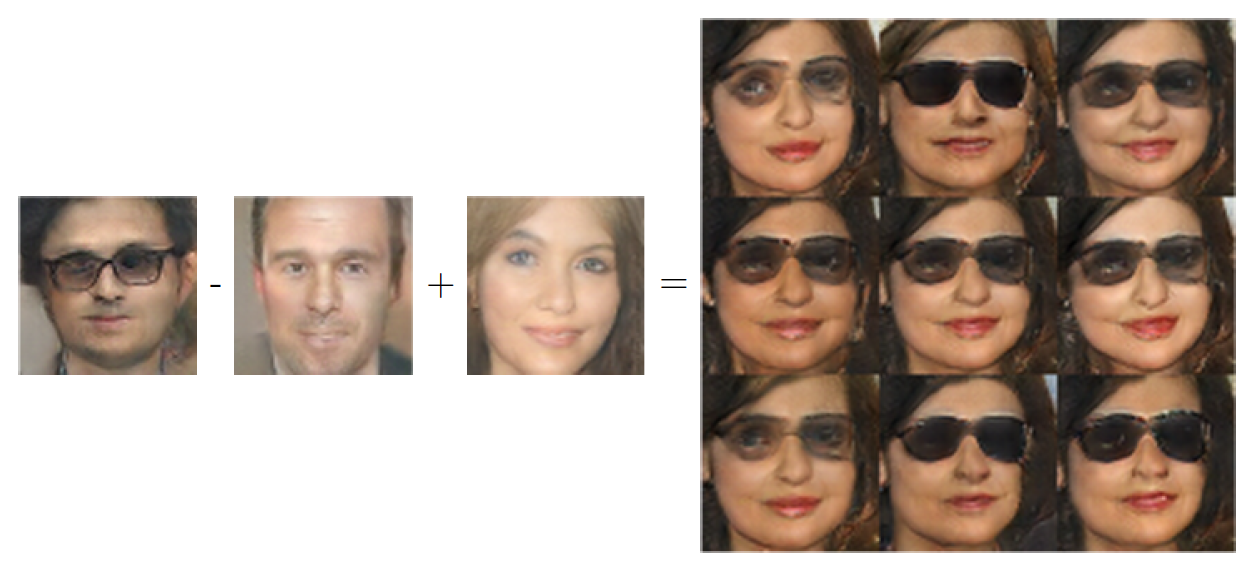
- Arithmetic on Image Embeddings
- By designing Algorithms for Navigation in a Meaningful latent space, we can imitate a generative process which might resemble abstract reasoning.
- Examples:
- Extracting hierarchies and relationships between objects from an image through traversal of sub-images directly in the latent space (Image embeddings);
- Writing code on top of pre-defined functionality by expanding parse trees directly in the latent space (Graph embeddings);
- The analogy to the human mind is that latent representations are thoughts derived from perceptual information.
- The navigation in the latent space then corresponds to thinking about thoughts, a mechanism which allows us to generate relevant actions which derive from an abstract representation of a situation, rather than exact copies of actions performed in the past in a similar situation.
Applications linked to our past research:
- Clustering Computer Programs based on Spatiotemporal Features
- Aster Project: AST derived Code Representations for General Code Evaluation and Generation
- Clustering and Visualisation of Latent Representations
- Learning Semantic Web Categories by Clustering and Embedding Web Elements
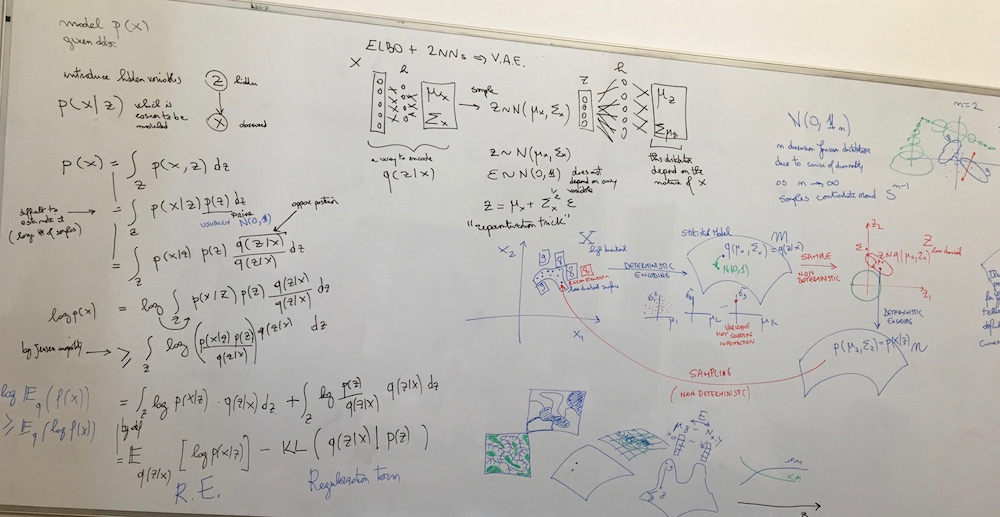
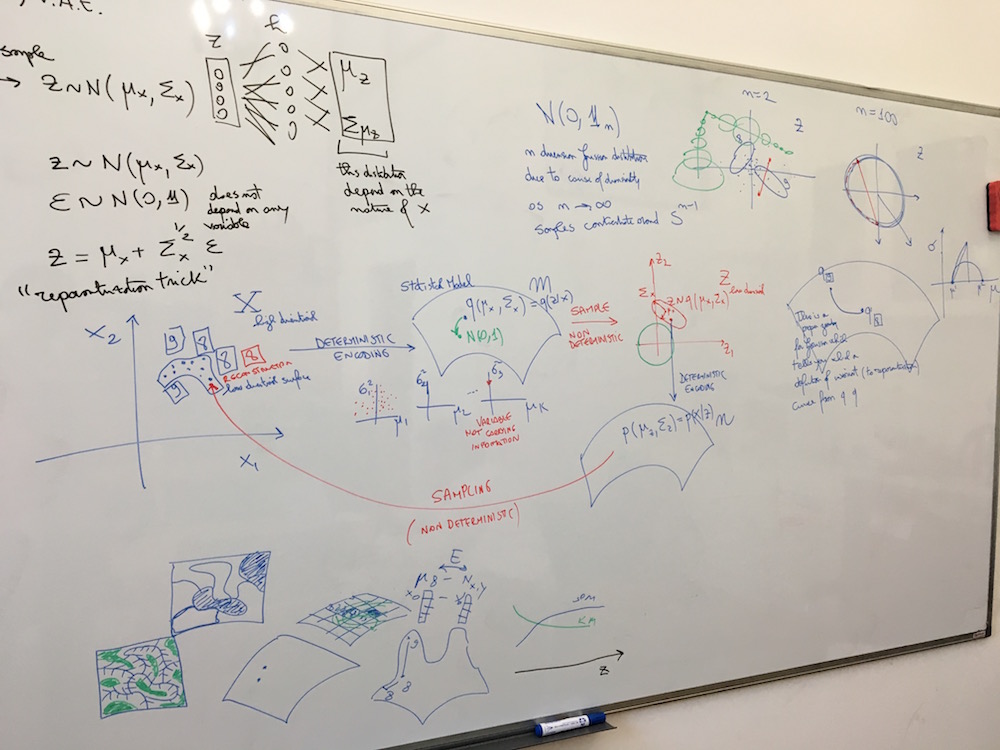
Idea: Model latent variable as a variable drawn from a learned probability distribution.
Result: By comparison to the autoencoder the latent space is continuous and interpolation between samples is possible. See VAE tutorial 1 for more explanations on this topic.
Key-words: Prior, posterior, probability distribution, log-likelihood, jensen inequality, re-parametrization trick, sampling from a distribution.
| Representation | Description |
|---|---|
 from VAE tutorial 2 from VAE tutorial 2 |
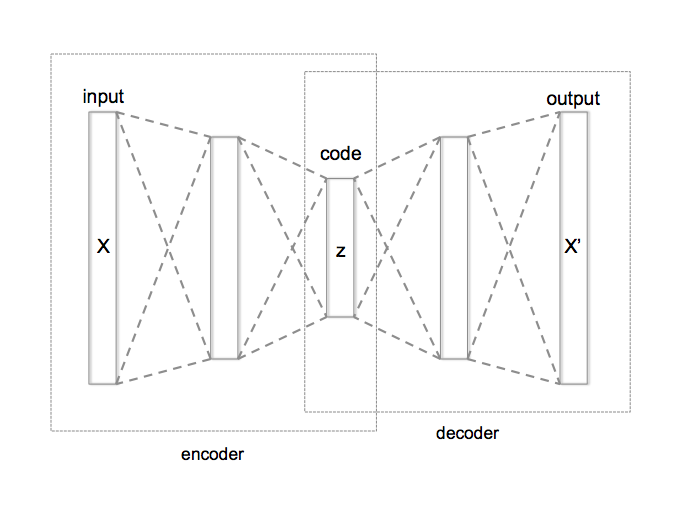
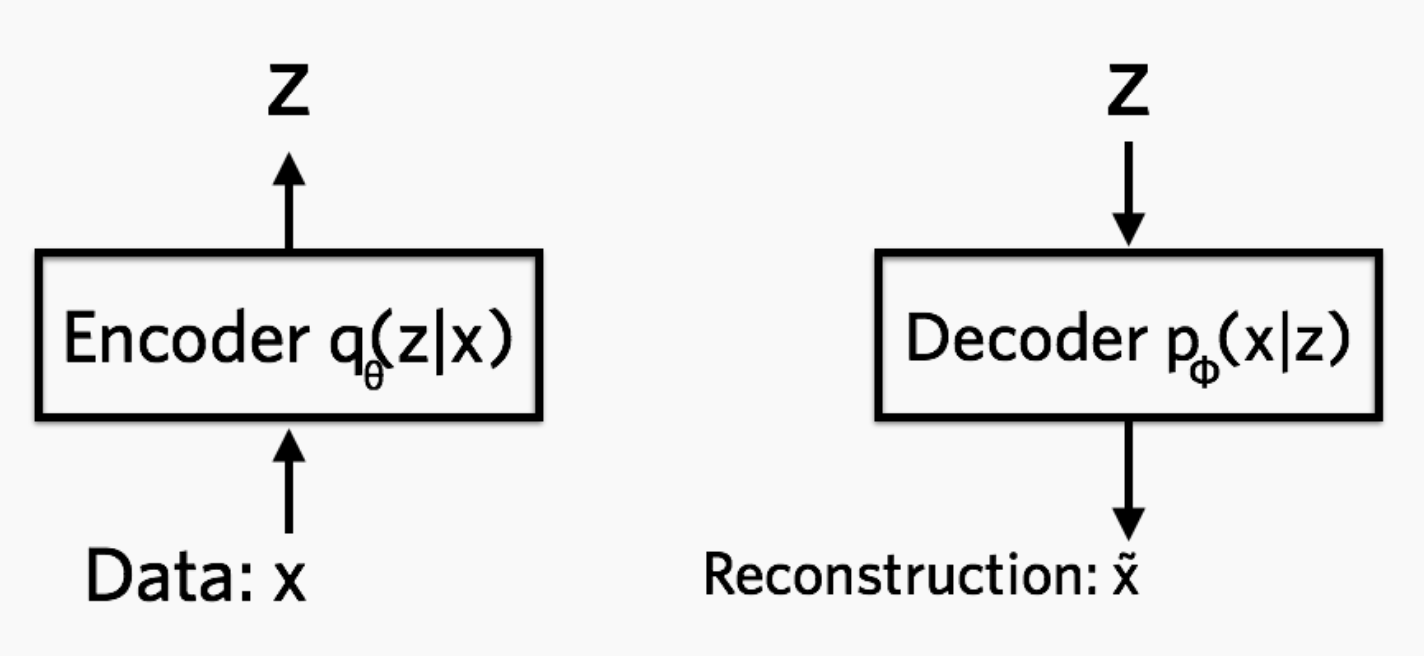
Encoder: q models probability of hidden variable given data, Decoder: p models data probability given hidden variable |
Variables and Algorithm
- s = current iteration, L = iteration limit, D = input dataset
- t = index of vector in dataset, W = weight vectors
- v = index of node in the map, u = index of best matching unit
- theta(u,v,s) = neighbourhood function between u & v at iteration s
- alpha(s) = learning rate at iteration s
- Randomize W
- Pick D(t)
- Traverse each node v in the map
- Compute (euclidean) distance between W(v) and D(t)
- Record v with minimum distance as u
- Update W in the neighbourhood of the BMU (including itself) by pull them closer to the D(t)
- W(v,s+1) = W(v,s) + theta(u,v,s) * alpha(s) * (D(t) - W(v,s))
- Increase s and repeat while s < L
By exploring properties/biases of latent spaces, we can address the interpretability problem in DNNs [C1].
Description:
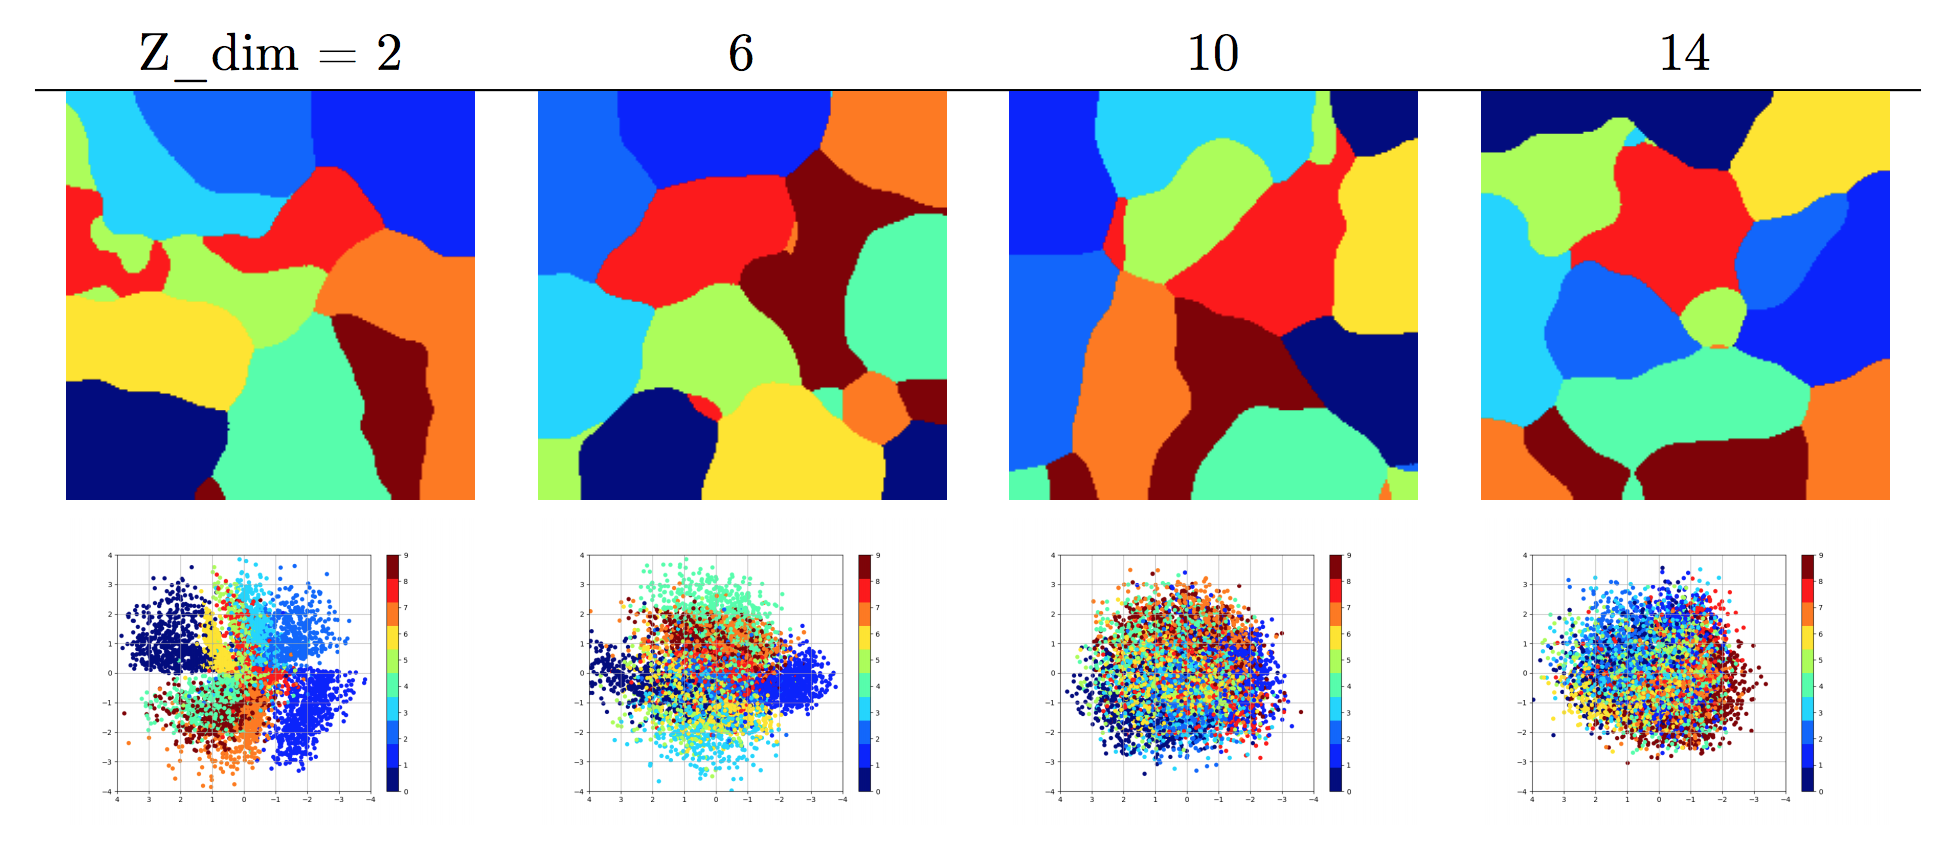
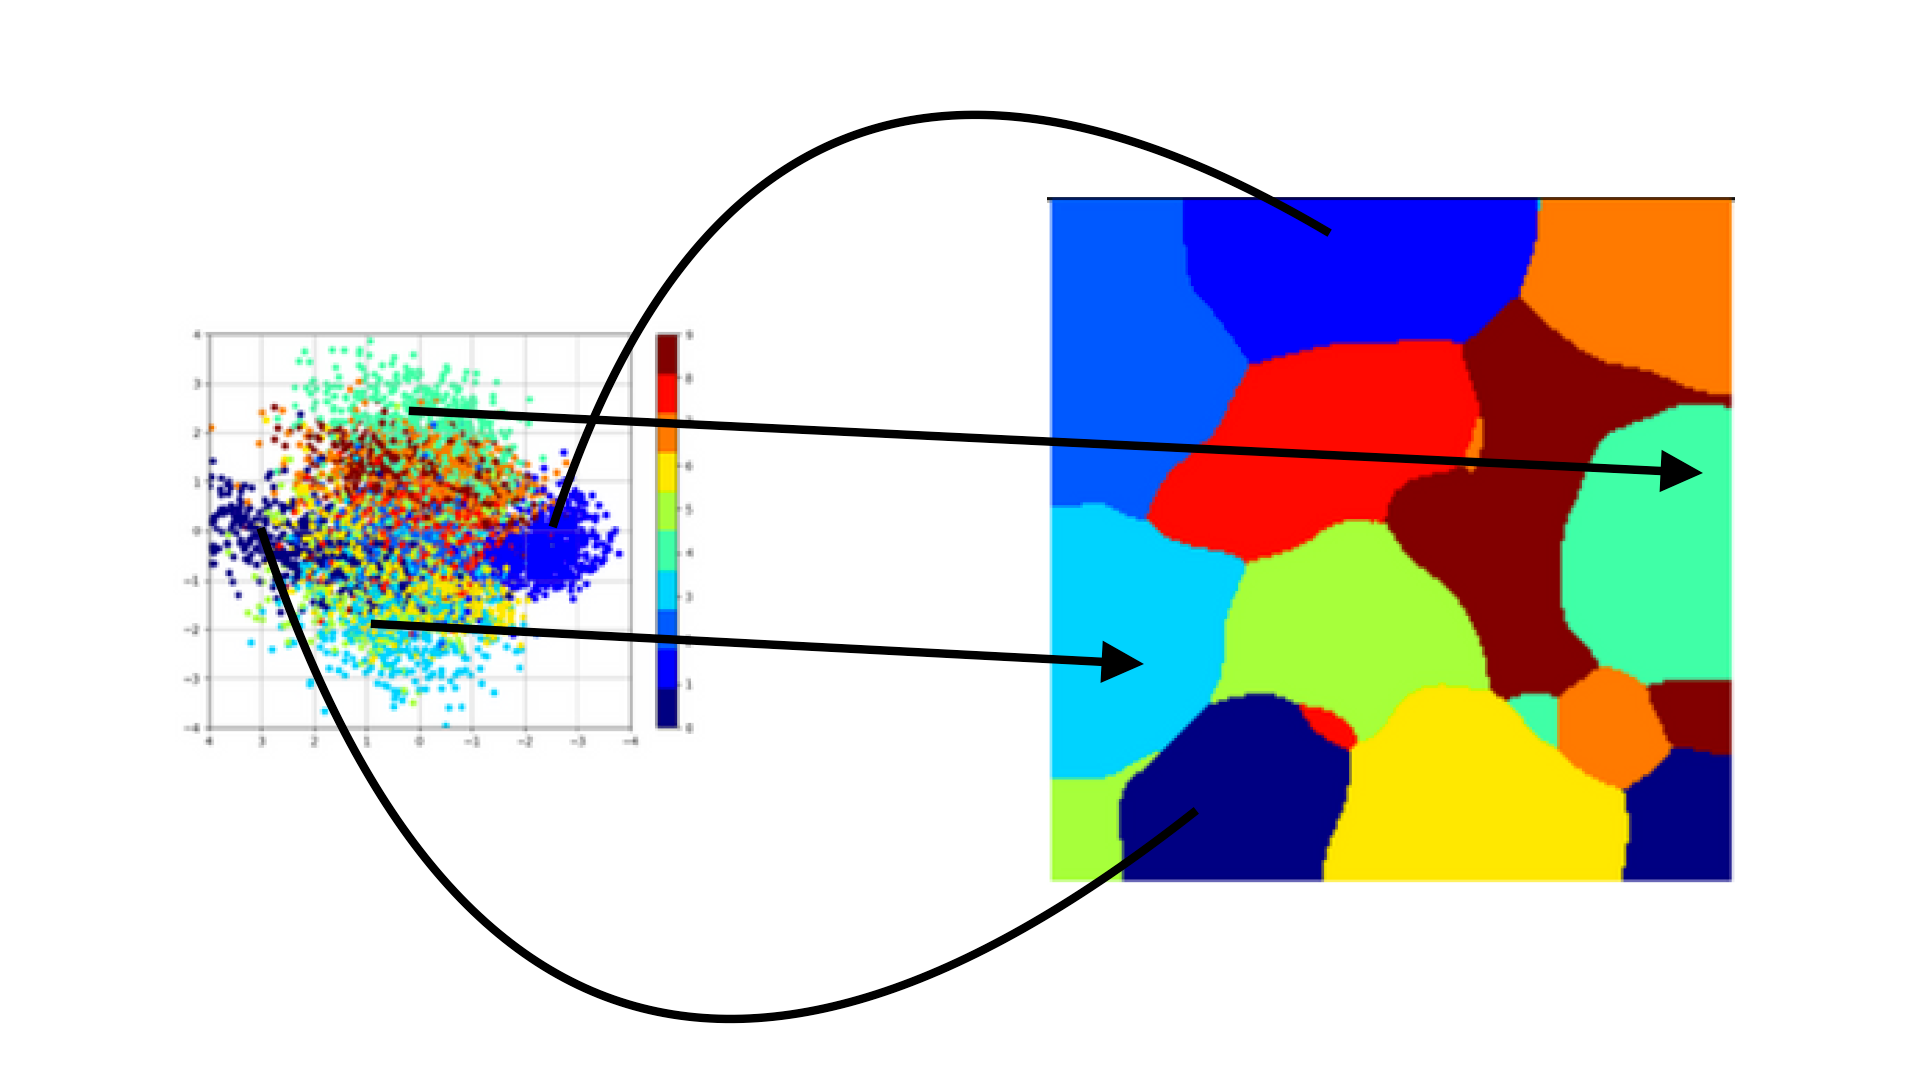
- SOM clustering (first row) and PCA (second row) 2D projection of latent MNIST as learnt by a VAE
- Z_dim = 2, latent representation of samples, no projection
- latent space becomes denser as Z_dim increases (see PCA)
- latent space can be remodeled (density changes) through topological projection (see SOM)
Observations regarding data complexity:
- only k principle components obtained from Z (latent space) will be meaningful (in the case of MNIST k between 10 and 20)
- clusters are well-formed even with limited training (based on homogeneity & silhouette scores and manual evaluation)
Application to latent interpolation:
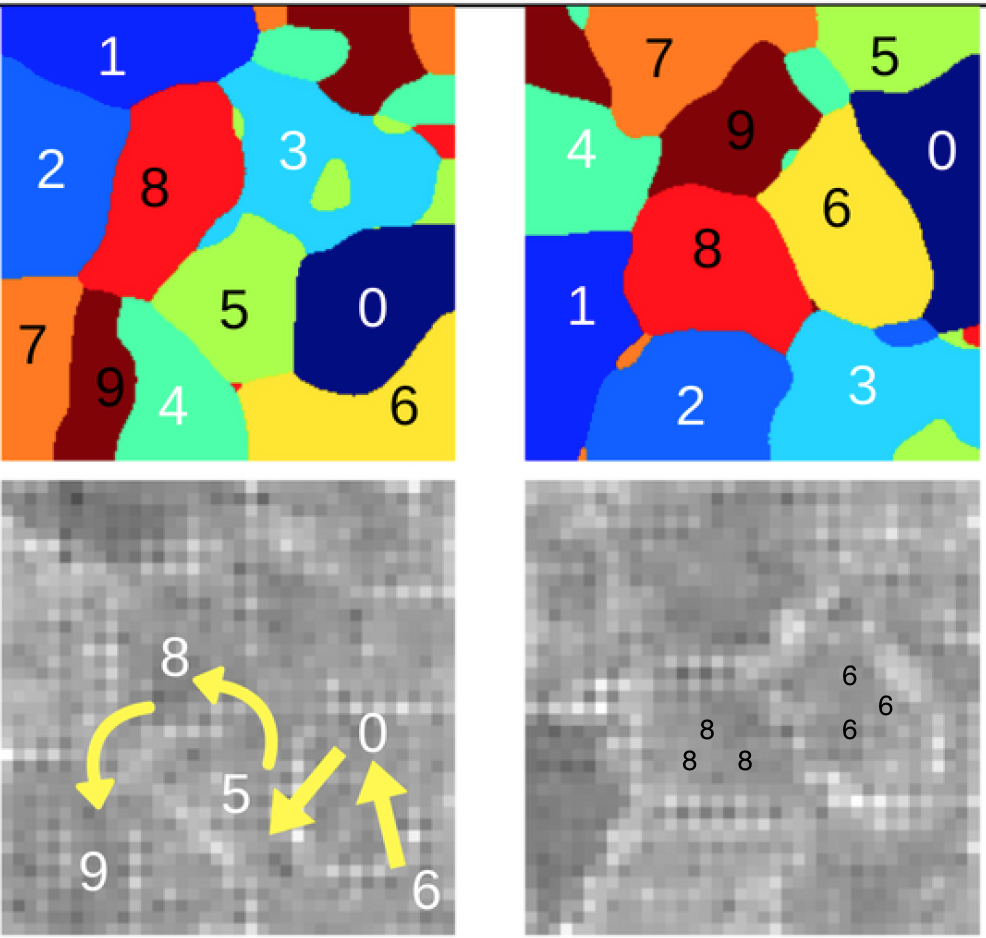
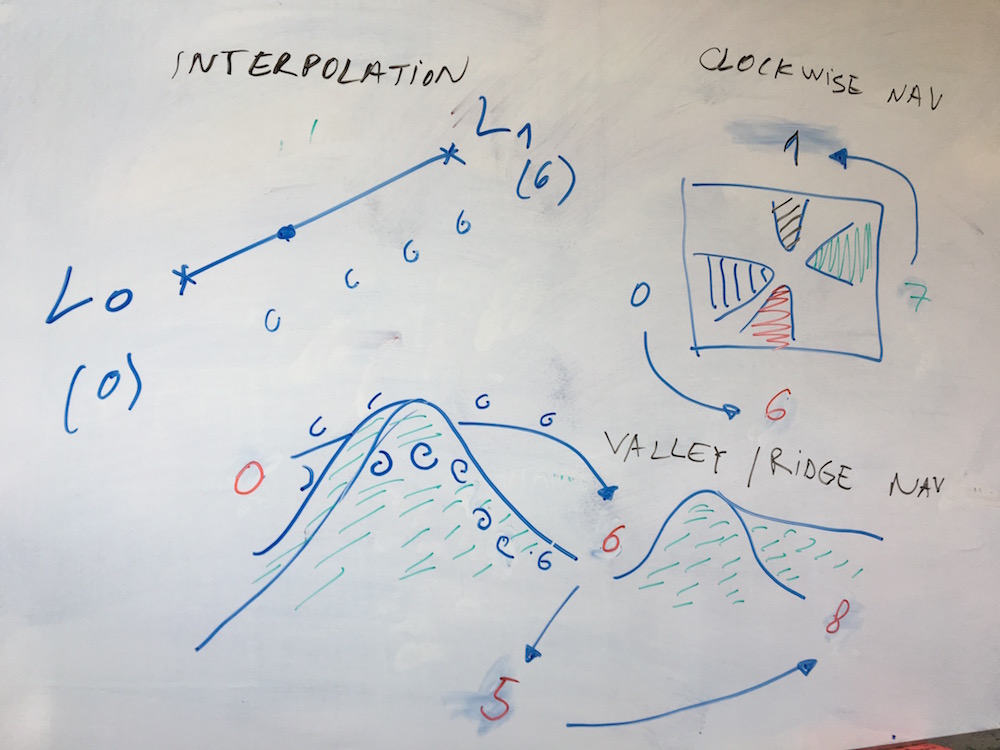
- continuity means that we can have a smooth transition from a representation of the handwritten-digit 8 to a representation of handwritten-digit 6
- a common way to perform interpolation is the linear one, which assumes the latent representations to be in a euclidean space, where straight lines can be drawn from any point to any other point
- depending on the meaning of the latent representations, other distance measures and interpolation types might be necessary
- for the VAE case, the latent space is a manifold on gaussian distributions (see Fisher-Rao and Wasserstein geometries [M1])
Application to semi-supervised/few-shots learning:
- enclose landmarks (convex hull) defined by few labeled samples (few-shot learning) on clusters formed from latent representations of unlabeled data
- also, for data that belongs conceptually to the same class, yet exhibits variability in labels, clusters can help us identify similarities in these labels
Application to structure extraction:
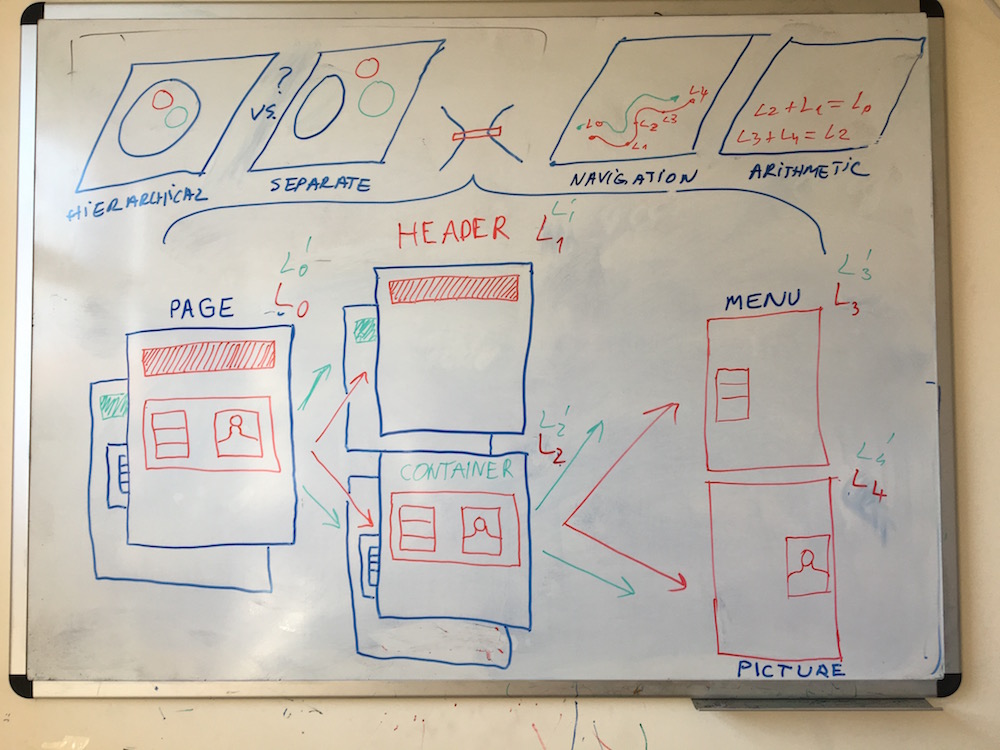
- suppose we would like to reconstruct the hierarchical data model that rendered an image
- examples range from screenshots of graphical interfaces to photo-realistic scenes
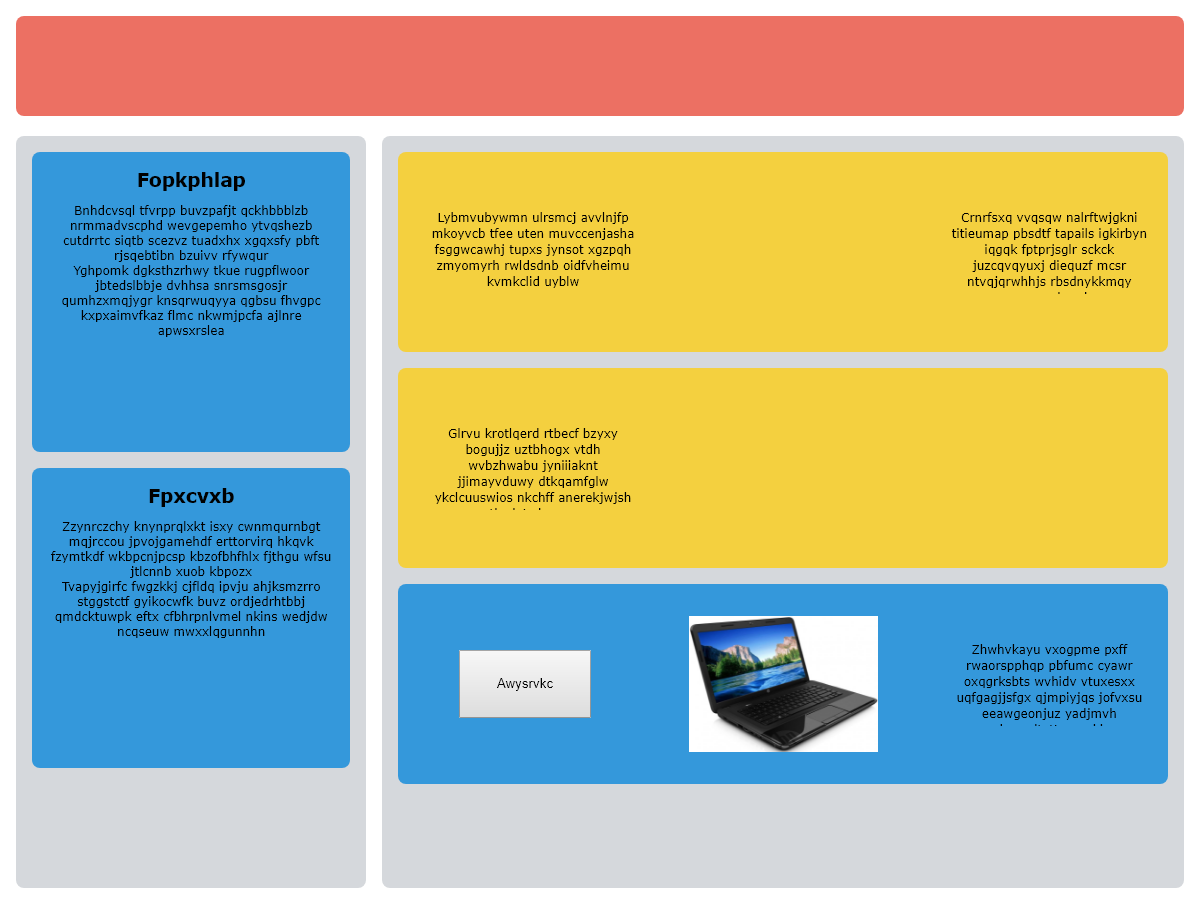
- in graphical interfaces: decompose a web page into main web elements - header and container with a left menu and a right grid with 3 buttons
- in photo-realistic scenes: a group of 3 people inside a car without doors on the right lane of a highway
- can a model trained with parts and segmented sub-parts shape the latent space such that decomposition of parts into sub-parts is possible?
- interpolation and composition as starting experiments, then structure extraction
Data domain: synthetic, image
Dataset:
- 28 x 28 x 3 sized images
- 2 labels: shape and color
- shapes: square, circle, triangle
- colors: red, green, blue
| Sample | Description | Sample | Description |
|---|---|---|---|
 |
red square |  |
red triangle |
 |
blue circle |  |
red circle |
 |
green square |  |
blue triangle |
 |
green triangle |  |
blue square |
Primary Goal:
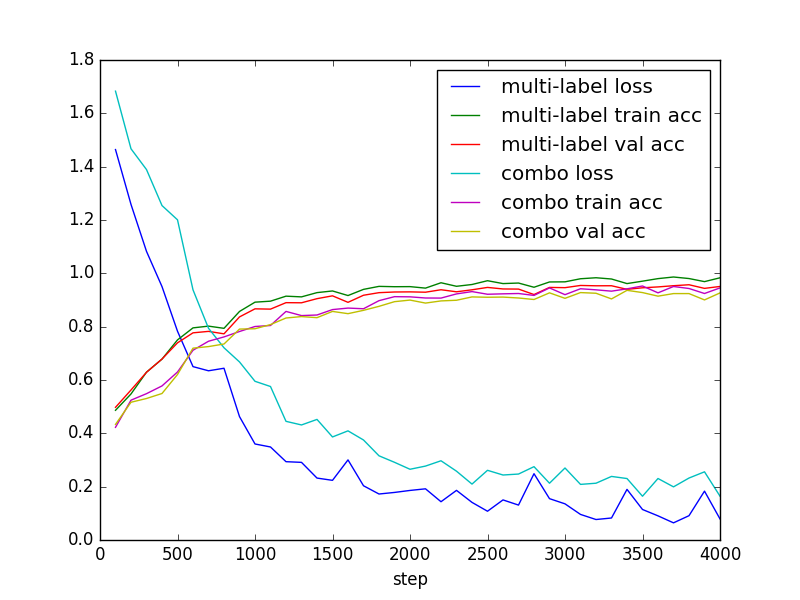
- explore multi-label, multi-class classification problem
- 3 options:
- multi-label (multiple logit sets)
- combination of labels (one logit set, each logit is a combo)
- one neural-network for each label
Secondary Goal:
- inspect learned features in intermediate CNN layers
Data domain: synthetic, image and text
Dataset:
- 56 x 56 x 3 sized images
- 2 figures per image, obtained by concatenation of shape-color figures
- 2 relations: "above" and "next_to"
- for the latent arithmetic extension, also add images with only one figure
| Sample | Description |
|---|---|
 |
green square above blue square |
 |
green triangle above red square |
 |
blue circle next_to red square |
 |
green square next_to blue triangle |
Primary Goal: Test RNN for textual description of scenes.
Secondary Goal: Use attentional RNN to visualize the parts of the image the model looks at in order to generate a certain word in the description.
Resources: See [A1, A2] for visual attention models and [A3, A4] for text attention models.
Extension: Latent arithmetic with figures. What is the relation between the latent representation of an image with a circle on top of a square and the latent representation of sub-parts of the image (the image of a circle and the image of a square)?
More complex spatial relations:
| Sample | Description |
|---|---|
 |
3 circles, 1 square, 5 triangles |
 |
3 large red squares, one square on top of the other |
 |
2 large red squares, 3 triangles on top |
 |
2 circles, 2 squares and 5 triangles |
Data domain: synthetic, image and text
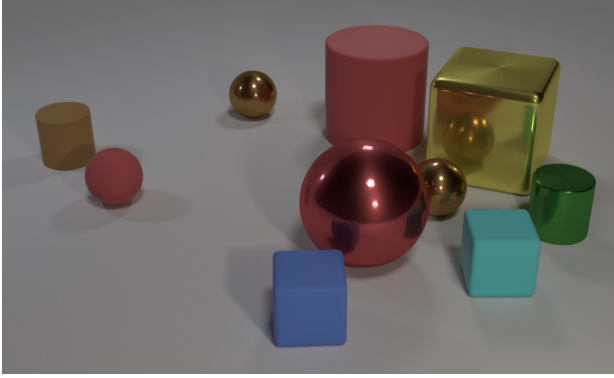
Purpose: Test mock models for CLEVR with less data.
Data domain: natural, image and text
Premise: Question types include attribute identification, counting, comparison, spatial relationships, and logical operations.
Primary Question: Can we group similar questions together?
Secondary Question: Can we generate new questions that are relevant?
The dataset is a great subject for the application of Relational Networks [G1], which belong to the family of Graph Nets.
Tutorials:
Models that work well for this dataset could be extended to do some sort of programming through the following links.
Primary Idea: Question asking
- When writing code, programmers often ask questions about the state of the program and from the answers infer the next steps to take in order to accomplish their goal.
- For instance, in the world of objects, we might ask which figures to swap such that a certain order relation is satisfied.
Topics to explore further: which questions do you ask yourself when writing code/solutions to programming tasks?
Secondary Idea: Tangible programming
- A more concrete example would be to group objects in a sequence such that similar colors are consecutive.
- This would translate into asking a lot of questions similar to the ones showcased by the CLEVR dataset
Topics to explore further: tangible interfaces, embodied cognition and interaction.
Third Idea: Logical questions modeled through programming
- Does the first object have the same color as the second one?
- More generally, does the object on position i have the same color as the object in position i + 1
- Where is the first object to have red color? Are there any objects colored with red at all?
Fourth Idea: Causal inference from answers to logical questions
- If object on third position is yellow and object on sixth position is blue, swapping the two will result in which color on 6th position?
- Does the initial color on 6h position even matter?
- What if a pattern of movements always results the same output? How can such patterns be found?
- Can an agent model optimal behavior and generate such patterns?
- Model three levels proposed in the ladder of causation by Pearl [P1]: Association, Intervention and Counterfactuals
- Does curiosity help?
Data domain: synthetic, image, tree and text
| Webpage | Element masks |
|---|---|
 |
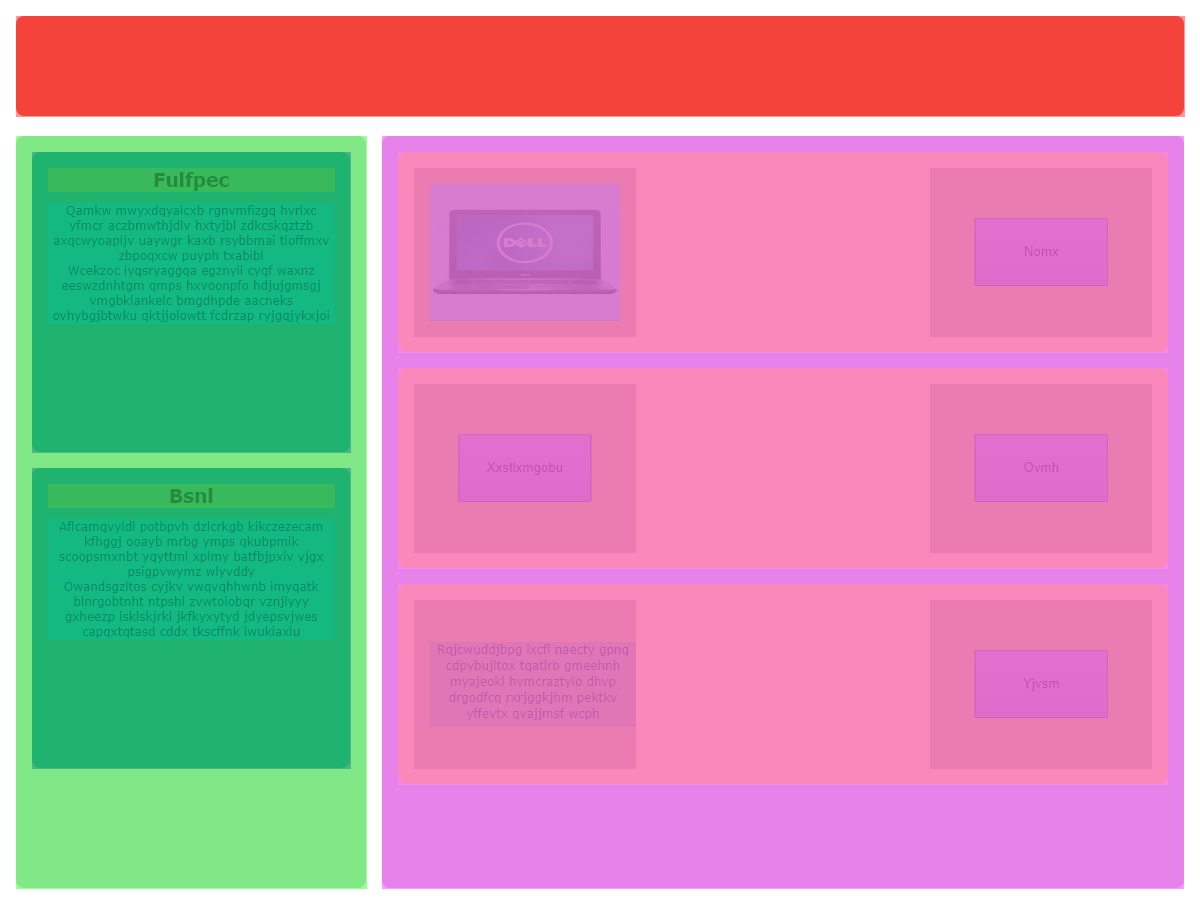 |
Description: This dataset was used to compare the results of models which infer html code from web page screenshots. An initial experiment compared the end-to-end network (pix2code) with a neural network for web elements segmentation and a tree decoding based on overlaps.
Extension: Latent arithmetic with web elements
| Header | + | Menu | + | Grid | = | Page |
|---|---|---|---|---|---|---|
 |
+ |  |
+ |  |
= |  |
Data domain: natural, image
Primary Idea: Clustering of latent representation
Secondary Idea: Latent interpolation
Third Idea: Few-shots learning after unsupervised training
[A1] Recurrent Models of Visual Attention, V. Mnih et al, 2014
[A2] Show, Attend and Tell: Neural Image Caption Generation with Visual Attention, K. Xu et al, 2016
[A3] Neural Machine Translation by jointly Learning to Align and Translate, D. Bahdanau et al, 2015
[A4] Effective approaches to Attention-based Neural Machine Translation, M. Luong et al, 2015
[C1] Cognitive Psychology for Deep Neural Networks: A Shape Bias Case Study, S. Ritter et al, 2017
[G1] A simple neural network module for relational reasoning, A. Santoro et al, 2017
[M1] A Comparison between Wasserstein Distance and a Distance Induced by Fisher-Rao Metric in Complex Shapes Clustering , A. De Sanctis and S. Gattone, 2017
[P1] [The Book of Why: The New Science of Cause and Effect] Judea Pearl, 2018.
