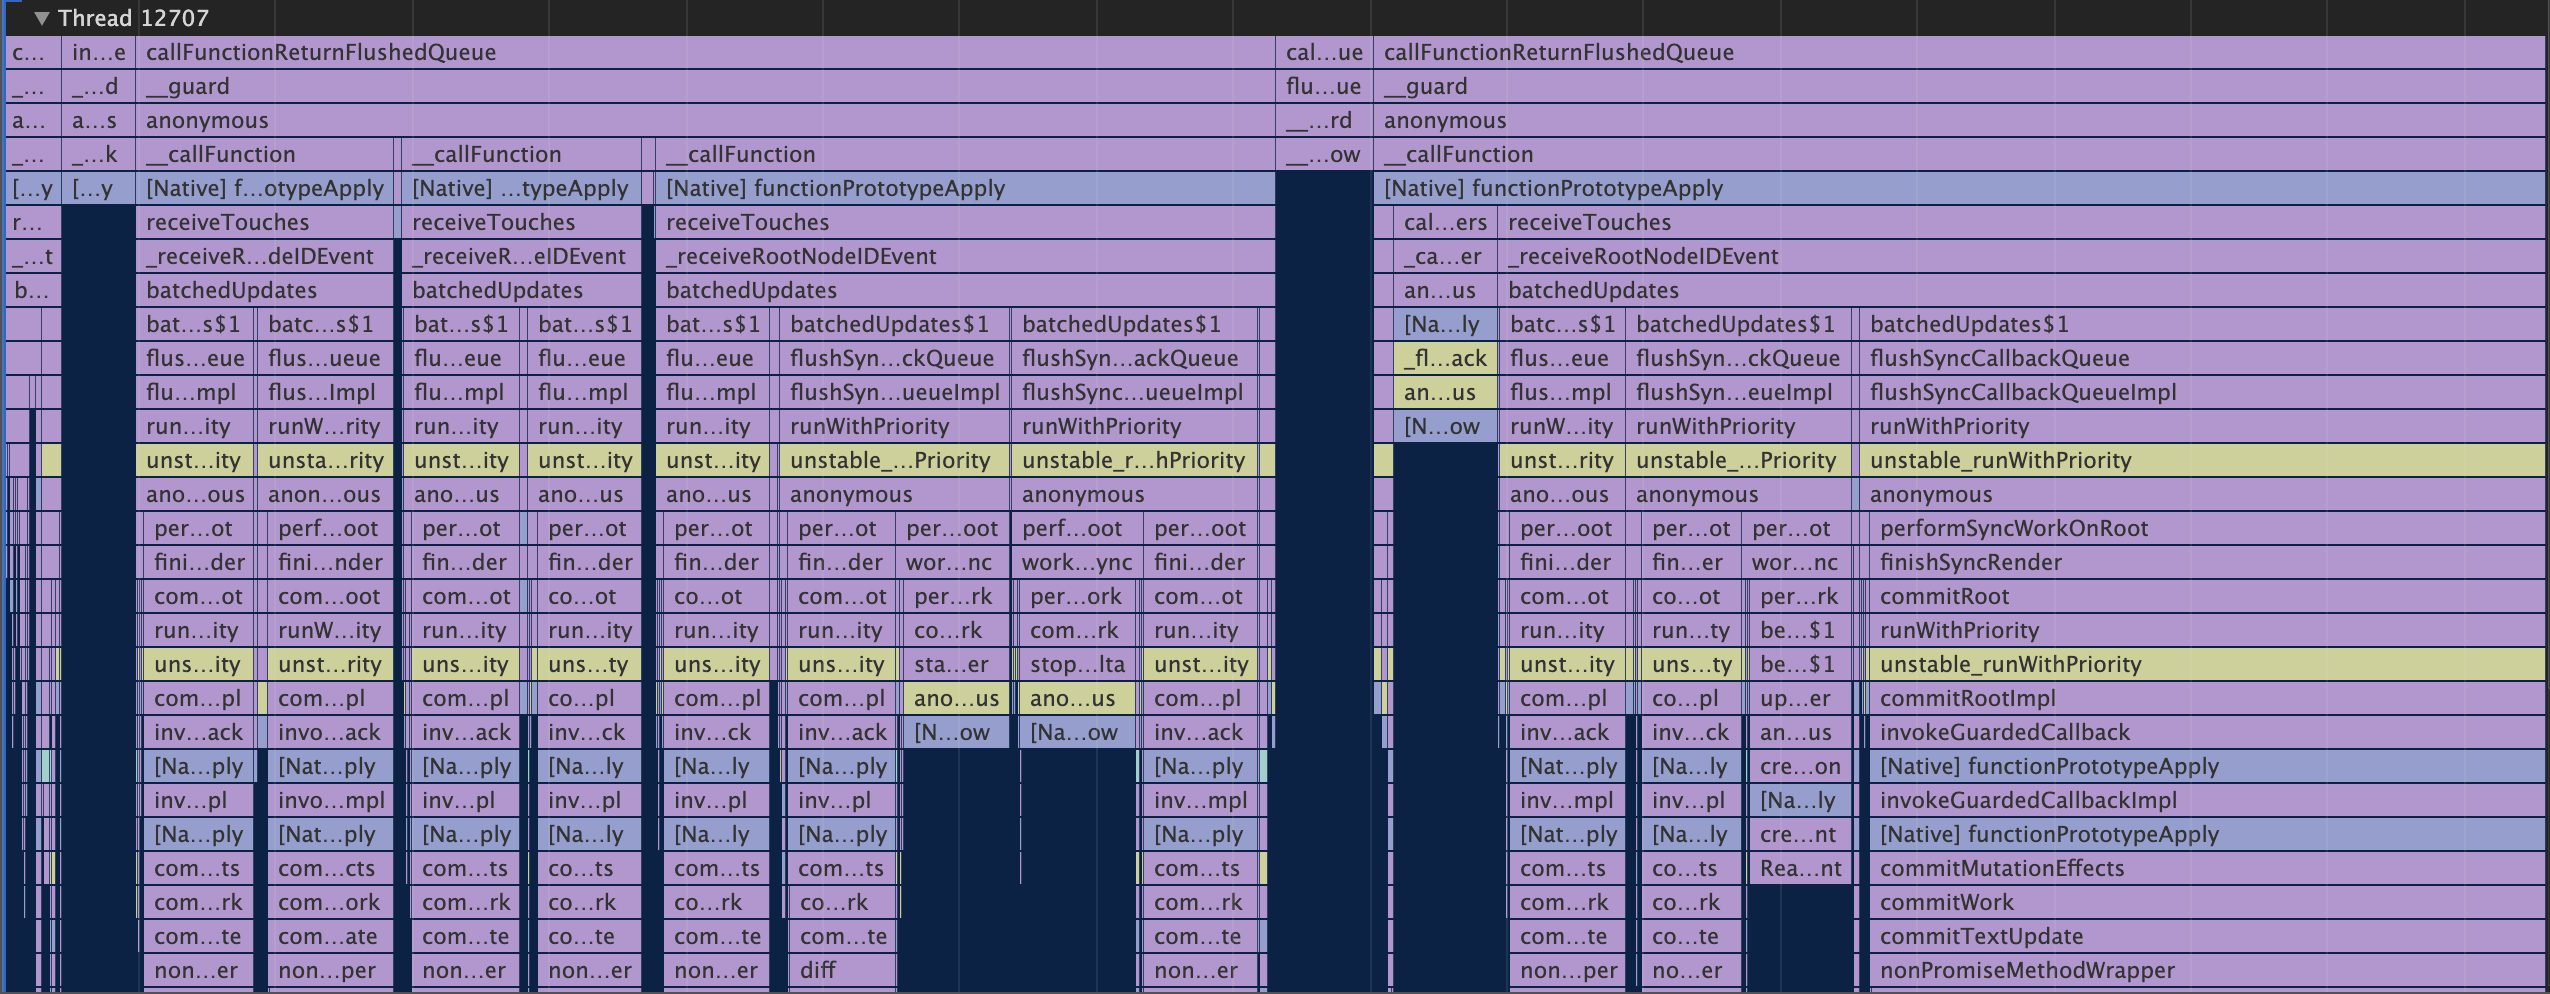
Visualize Facebook's Hermes JavaScript runtime profile traces in Chrome Developer Tools.
The Hermes runtime, used by React Native for Android, is able to output Chrome Trace Events in JSON Object Format.
This TypeScript package converts Hermes CPU profiles to Chrome Developer Tools compatible JSON Array Format, and enriches it with line and column numbers and event categories from JavaScript source maps.
If you're using hermes-profile-transformer to debug React Native Android applications, you can use the React Native CLI react-native profile-hermes command, which uses this package to convert the downloaded Hermes profiles automatically.
const transformer = require('hermes-profile-transformer').default;
const { writeFileSync } = require('fs');

const hermesCpuProfilePath = './testprofile.cpuprofile';
const sourceMapPath = './index.map';
const sourceMapBundleFileName = 'index.bundle.js';

transformer(
  // profile path is required
  hermesCpuProfilePath,
  // source maps are optional
  sourceMap,
  sourceMapBundleFileName
)
  .then(events => {
    // write converted trace to a file
    return writeFileSync(
      './chrome-supported.json',
      JSON.stringify(events, null, 2),
      'utf-8'
    );
  })
  .catch(err => {
    console.log(err);
});Open Developer Tools in Chrome, navigate to the Performance tab, and use the Load profile... feature.
| Parameter | Type | Required | Description |
|---|---|---|---|
| profilePath | string | Yes | Path to a JSON-formatted .cpuprofile file created by the Hermes runtime |
| sourceMapPath | string | No | Path to a source-map compatible Source Map file |
| bundleFileName | string | No | If sourceMapPath is provided, you need to also provide the name of the JavaScript bundle file that the source map applies to. This file does not need to exist on disk. |
Promise<DurationEvent[]>, where DurationEvent is as defined in EventInterfaces.ts.
- Using Hermes with React Native.
- Chrome Trace Event Format. Hermes uses the JSON Object format.
- Measuring JavaScript performance in Chrome


