This REANA reproducible analysis example demonstrates the use of the ALICE analysis framework to facilitate the analysis of ALICE collision and simulated data samples for both pp and PbPb data taken in the year 2010. The example was taken from an analysis example from the CERN Open Data portal and illustrates how to convert it into a reusable analysis (REANA) example, as it uses a complex computing environment that is not publicly available.
ALICE physicists use custom tools that facilitate the analysis of real or simulated ALICE data samples. This example demonstrates the use of the ALICE analysis framework on small samples of both pp and PbPb data taken in the year 2010.
Making a research data analysis reproducible basically means to provide "runnable recipes" addressing (1) where is the input data, (2) what software was used to analyse the data, (3) which computing environments were used to run the software and (4) which computational workflow steps were taken to run the analysis. This will permit to instantiate the analysis on the computational cloud and run the analysis to obtain (5) output results.
The analysis uses (i) an ALICE ESD data file for either pp or PbPb collisions and (ii) an ODCB magnet configuration database. For the ESD data file, let us take an example that was published by the ALICE collaboration on the CERN Open Data portal from Pb-Pb collisions. Here, we use the sample at 3.5 TeV from run number 139038 in RunH 2010. We select the third (0003) file that is about 360 MB large in order to have a reasonable number of events for the example.
$ mkdir -p data
$ cd data
$ curl -O http://opendata.cern.ch/eos/opendata/alice/2010/LHC10h/000139038/ESD/0003/AliESDs.root
$ cd ..
Note that data.txt file should contain the path to the downloaded sample data file.
For the magnet configuration database, let us take the OCDB.root file released on the
CERN Open Data portal
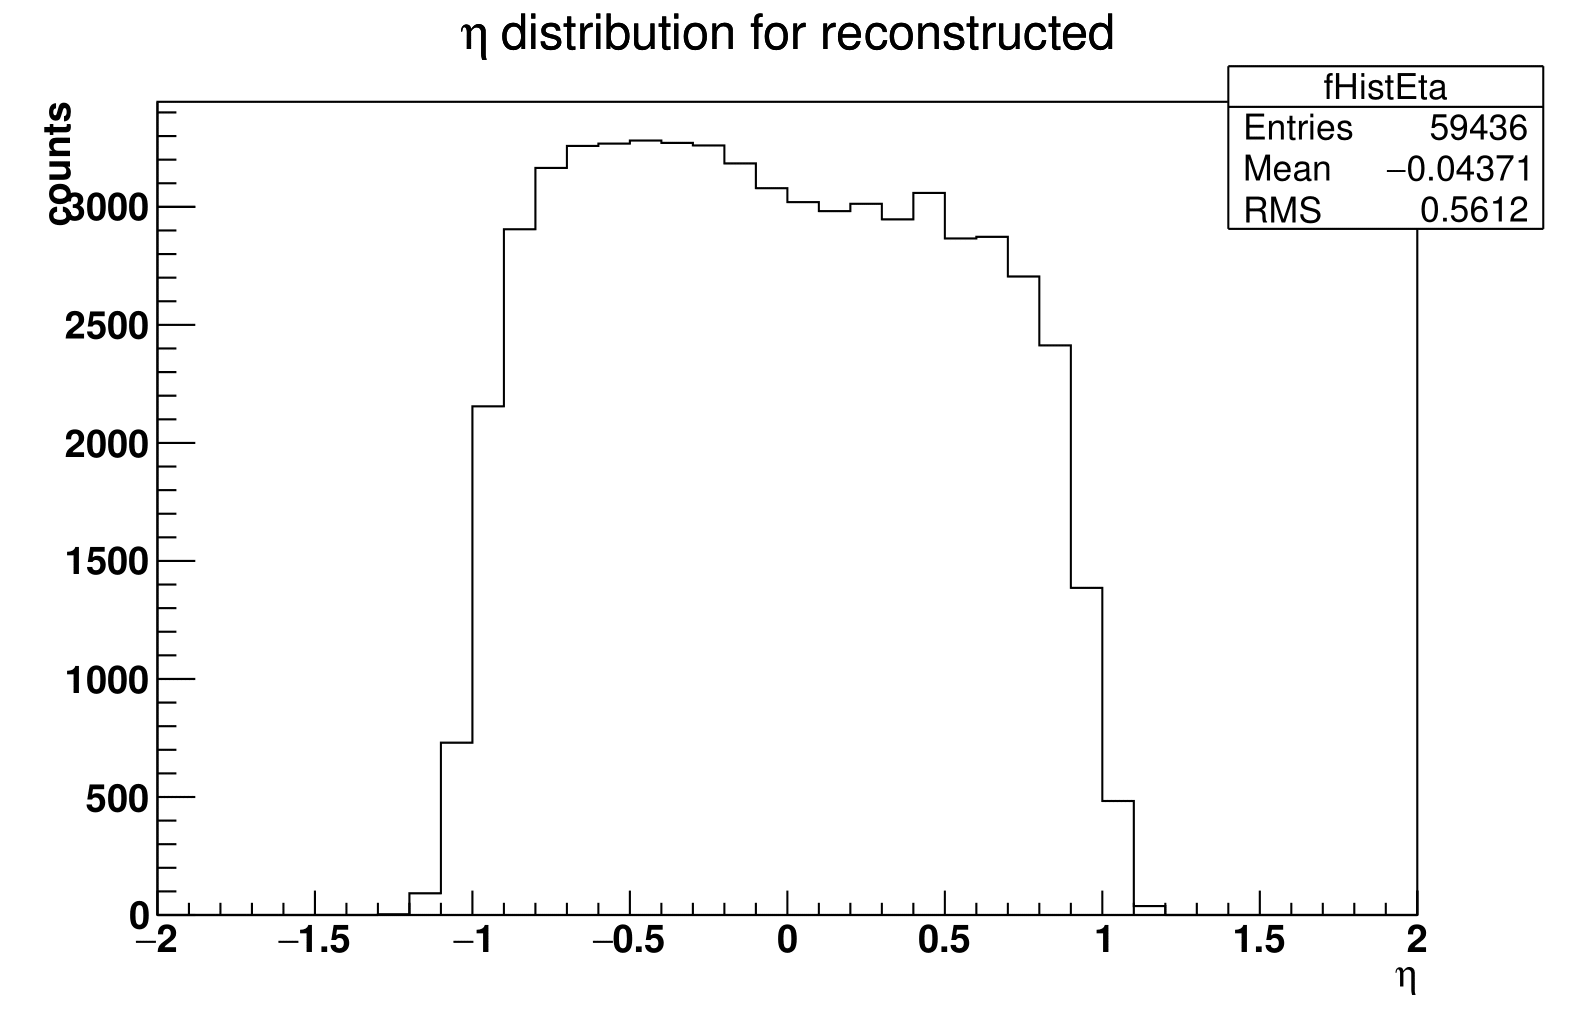
The user analysis is represented by a C++ class, which has to implement a few predefined methods to process one interaction event. A template analysis class extracting the inclusive transverse momentum and pseudorapidity spectra of all tracks can be modified to create your own analysis.
This example uses the AliPhysics analysis framework with the following source code files:
- fix-env.sh - to fix the configuration environment variables
- runEx01.C - the main analysis script
- plot.C - script to extract data and plot the figures from the resulting ROOT file
- AliAnalysisTaskEx01.cxx - the example script analysing the Pt spectrum
- AliAnalysisTaskEx01.h - ROOT library for customization
This example uses AliPhysics analysis framework. It has been containerised as reana-env-aliphysics environment. You can fetch some wanted AliPhysics version from Docker Hub:
$ docker pull docker.io/reanahub/reana-env-aliphysics:vAN-20180614-1We shall use the vAN-20180614-1 version for the present example.
Note that if you would like to build a different AliPhysics version on your own, you can
follow reana-env-aliphysics
procedures and set ALIPHYSICS_VERSION environment variable appropriately:
$ cd src/reana-env-aliphysics
$ export ALIPHYSICS_VERSION=vAN-20180521-1
$ make buildThis analysis example consists of a script to run the task using aliroot, and then plots the results.
The computational workflow is essentially sequential in nature. We can use the REANA serial workflow engine and represent the analysis workflow as follows:
                 START
                   |
                   |
                   V
+-----------------------------------------+
| (0) use data or download ESD input file |
|                                         |
|  $ curl -O http://opendata.cern.ch/...  |
+-----------------------------------------+
                   |
                   | ALIESD.root
                   V
+-----------------------------------------+
| (1) perform PT analysis                 |
|                                         |
|    $ root -b -q './runEx01.C'           |
+-----------------------------------------+
                   |
                   | run.logs
                   | AnalysisResults.root
                   |
                   V
+----------------------------------------+
| (2) plot sample histogram              |
|                                        |
|    $ root -b -q plot.C                 |
+----------------------------------------+
                   |
                   | plot_pt.pdf
                   | plot_eta.pdf
                   |
                   V
                  STOP
We shall see below how this sequence of commands is represented for the REANA serial workflow engine.
The test run will create ROOT output files that usually contain histograms.
$ ls -l AnalysisResults.root
-rw-r--r-- 1 root root  31187 July 18 17:35 AnalysisResults.root
The user typically uses the output files to produce final plots. For example, running
plot.C output macro on the AnalysisResults.root output file will permit to visualise
the pt distribution of the accepted events:
There are two ways to execute this analysis example on REANA.
If you would like to simply launch this analysis example on the REANA instance at CERN and inspect its results using the web interface, please click on the following badge:
If you would like a step-by-step guide on how to use the REANA command-line client to launch this analysis example, please read on.
We start by creating a reana.yaml file describing the above analysis structure with its inputs, code, runtime environment, computational workflow steps and expected outputs:
version: 0.3.0
inputs:
  files:
    - fix-env.sh
    - data.txt
    - AliAnalysisTaskEx01.cxx
    - AliAnalysisTaskEx01.h
    - runEx01.C
    - plot.C
    - OCDB.root
  parameters:
    data_location: http://opendata.cern.ch/eos/opendata/alice/2010/LHC10h/000139038/ESD/0003/AliESDs.root
workflow:
  type: serial
  specification:
    steps:
      - environment: 'docker.io/reanahub/reana-env-aliphysics:vAN-20180614-1'
        commands:
        - mkdir -p ./data && curl -fsS --retry 9 -o ./data/AliESDs.root ${data_location}
        - source fix-env.sh && root -b -q './runEx01.C' | tee run.log
        - mkdir -p results && source fix-env.sh && root -b -q './plot.C'
outputs:
  files:
    - AnalysisResults.root
    - results/plot_pt.pdf
    - results/plot_eta.pdf
We can now install the REANA command-line client, run the analysis and download the resulting plots:
$ # create new virtual environment
$ virtualenv ~/.virtualenvs/myreana
$ source ~/.virtualenvs/myreana/bin/activate
$ # install REANA client
$ pip install reana-client
$ # connect to some REANA cloud instance
$ export REANA_SERVER_URL=https://reana.cern.ch/
$ export REANA_ACCESS_TOKEN=XXXXXXX
$ # create new workflow
$ reana-client create -n my-analysis
$ export REANA_WORKON=my-analysis
$ # upload input code and data to the workspace
$ reana-client upload
$ # start computational workflow
$ reana-client start
$ # ... should be finished in about 1 minute
$ reana-client status
$ # list output files
$ reana-client ls | grep ".pdf"
$ # download results root file and generated plots
$ reana-client download
Please see the REANA-Client documentation for
more detailed explanation of typical reana-client usage scenarios.


