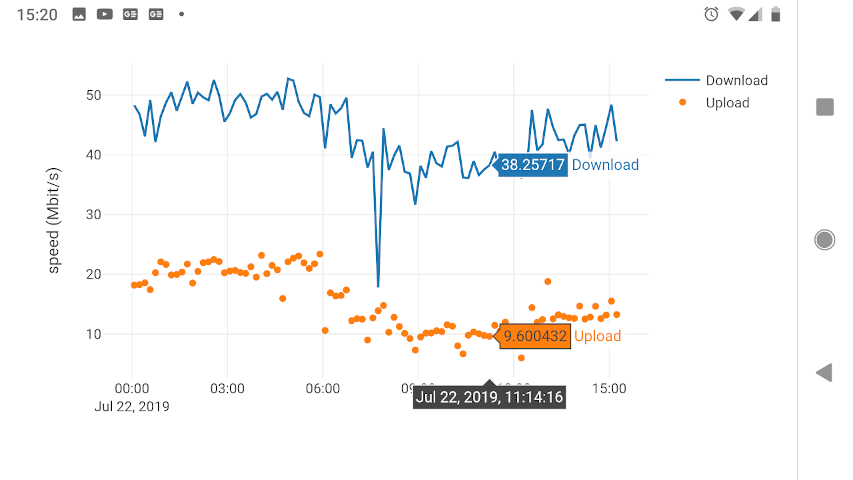
Visualize data generated by speedtest-cli in a web app powered by Plotly
Start collecting data. Ready-to-use solutions for doing so are available here and here.
Get up and running instantly, with a speedtest.csv file in your home dir and logs written to stdout.
   # Please adapt details (container timezone, sitename) to your needs.

   docker run -ti -p 80:5000 -v ~:/root -e FLASK_DEBUG=1 -e "TZ=EST" \
      -e "INFILE=/root/speedtest.csv" -e "SITENAME=my provider" \
      shuntingyard/speedtest_http
Please continue reading here for more details.


