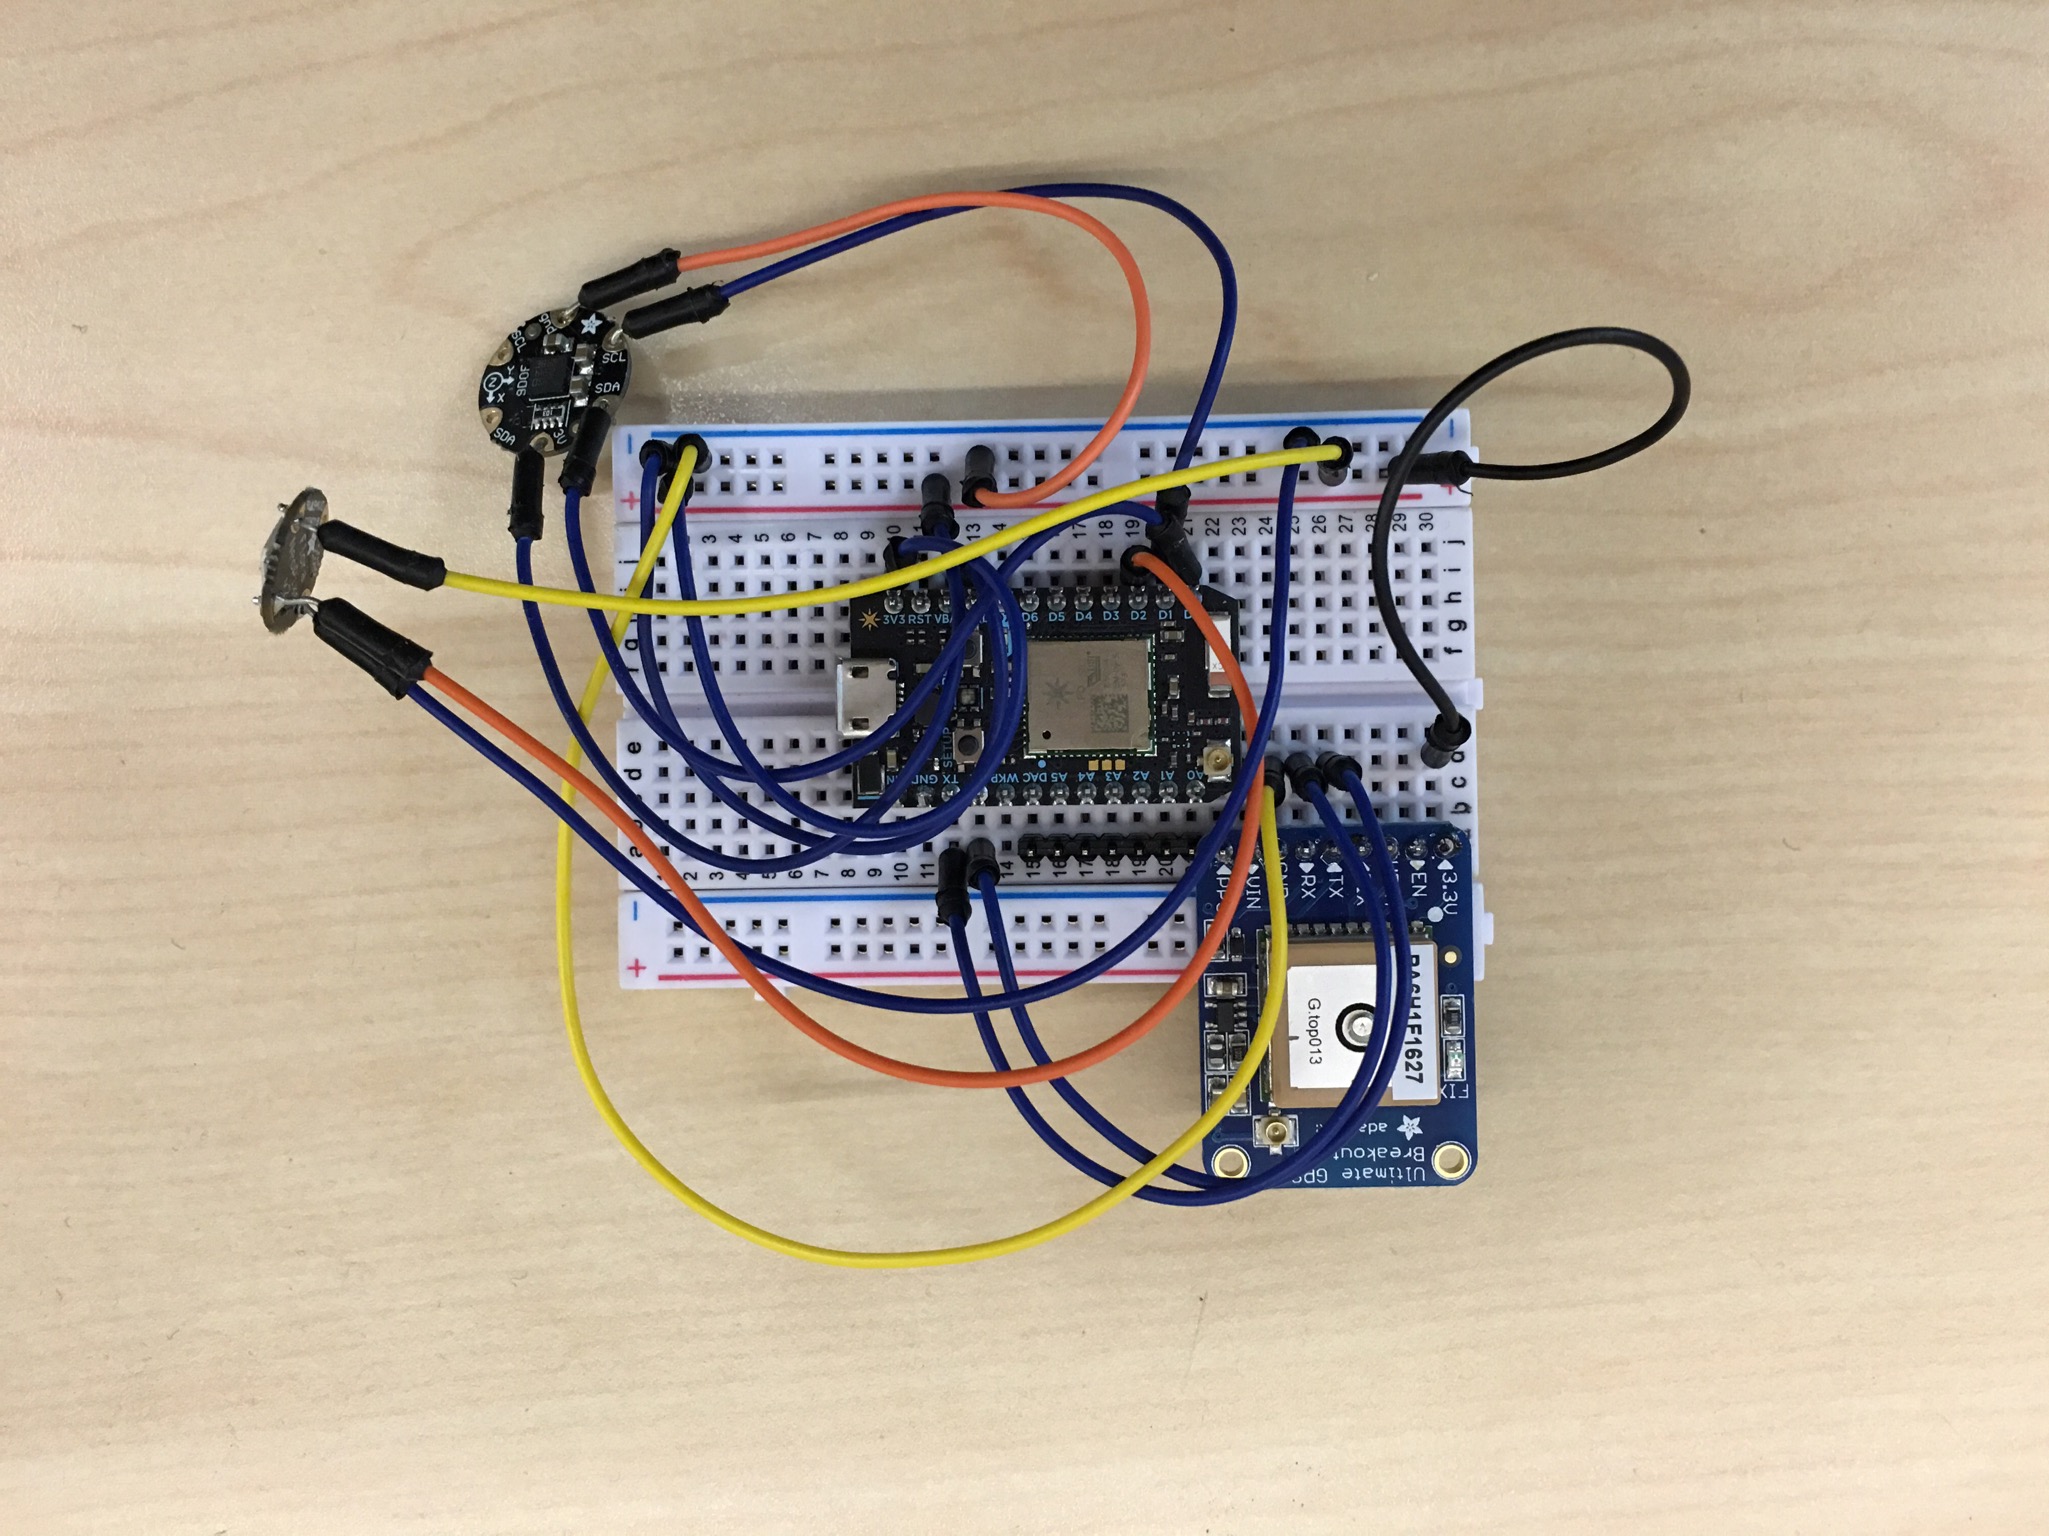
HCIN 720 Project 2: measuring acceleration and record location
##Introduction The project is composed of two parts: ###1. Input The device is used to encourage drivers to be considerate when there are other passengers on the car. When the driver drives aggressively, the device will show red. Services like Uber or public transit can use the data to evaluate the performance of their drivers. The device records road conditions and locate bumps and dips on the road. ###2. Output It is a simple navigation tool. The device reads the address of a destination input by the user and shows red if the car is driving further away form the destination and shows green if closer.
##Circuit
###1. INPUT ####Parts used:
- Motions Sensor: FLORA 9-DOF Accelerometer/Gyroscope/Magnetometer - LSM9DS0 - v1.0
- GPS: Adafruit Ultimate GPS Breakout - 66 channel w/10 Hz updates - Version 3
- LED: Adafruit NeoPixel
####Data Data read from the motions sensor and GPS are sent to thingspeak.com via Particle Webhook. Every 15 seconds, latitude, longitude, acceleration on x, y and z axis are sent in chunks of 255 characters. (255 is the max length thingspeak.com will take for a single entry).
###2.OUTPUT ####Parts used:
- GPS: Adafruit Ultimate GPS Breakout - 66 channel w/10 Hz updates - Version 3
- LED: Adafruit NeoPixel
####Data
With Javascript, address of the destination location is sent to Google Geocoding API to get the latitude and longitude of that address. The latitude and longitude are upload to thingspeak.com. The photon reads this data via Webhook and uses the gps to determine the current location of the device. The current location is compared against the destination.

##Visualization Data from Output is visualized using Paper.js. Driving paths are mapped on the canvas. Red dots represent inconsiderate driving (acceleration of x or y exceeds the threshold). Blue dots represent bumpy road (accerelation of z exceeds the threshold).
