The goal of the project is to assess the PV-potential of areas owned by SBB. We use a dataset from SBB containing: Jahresverbrauch, Anschlüsse, and Gebäude-shapes, for each address. On this dataset we did a general potential analysis over all addresses. For a more detailed assessment and visualization of potential "Zussammenschlüsse" of adjoining parcels we linked the SBB data with the swiss energy planning app of geoimpact which collects, links, and visualizes several open datasets (e.g., from Sonnendach, Elcom, ...)
PV-potential over all SBB-areas:
**** 153 GWh (LCOE<10 Rp/kWh) --> 0.3% of total swiss electricity consumtion ****
**** 270 GWh (LCOE<15 Rp/kWh) --> 0.5% of total swiss electricity consumtion ****
CO2 reduction potential over all SBB-areas:
**** ~7000 tons of CO2 reduction (LCOE<10 Rp/kWh) ****
**** ~12000 tons of CO2 reduction (LCOE<15 Rp/kWh) ****
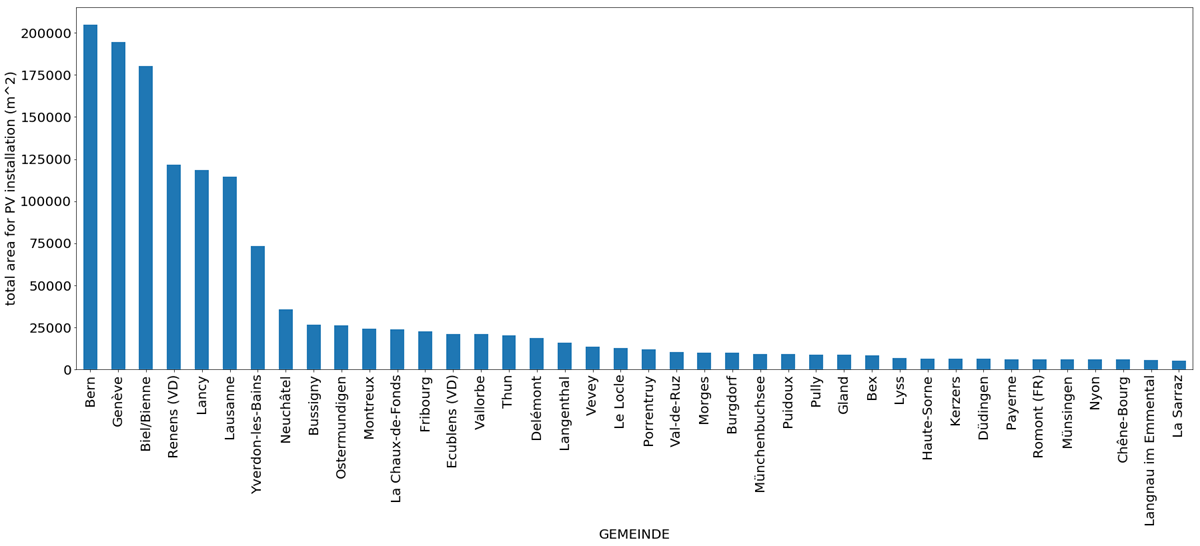
Figure: Total electricity generation potential from PV: 130 GWh (LCOE<10 Rp/kWh), 270 GWh (LCOE<15 Rp/kWh). Ranking of Gemeinde by total potential area for PV installation (roof area that intersects and within the parcel):

Figure: Potential vs. PV LCOE for each parcel. With Gemeinde names where the parcel is located in. Parcels on on top left corner (high potential, low LCOE) shall be looked into:

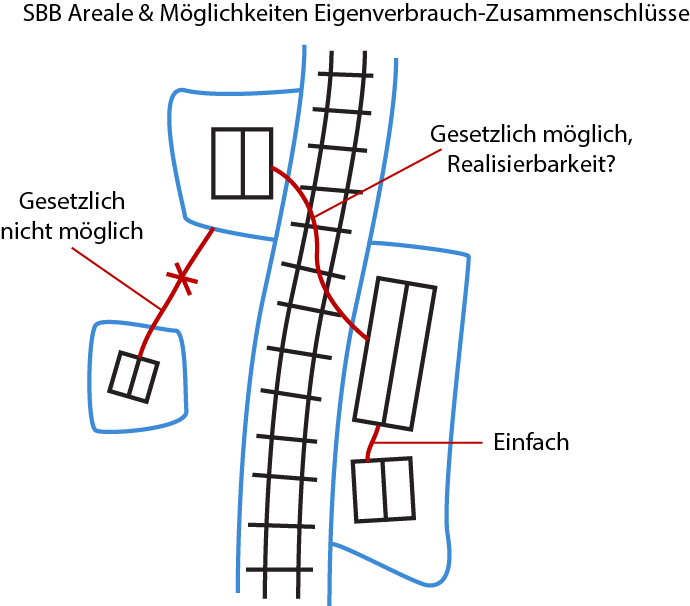
When you want to find ZEV you need to consider the geographic locations of the SBB-parcels, most importantly if two parcels are linked to each other through parcels that belong all to the same owner. In the case of SBB the ownership of train-track-parcels is especially interesting as they link different parcels over a large range (virtually over the whole country), which allows potentially for huge ZEV (see figure "SBB Areale & Möglichkeiten ZEV"). However, it is not clear yet if the connection across train tracks is physically feasible and makes economically sense.
We approach the assessment of the potential for ZEV with a qualitative model considering the aspects: "Energie", "Wirtschaftlichkeit", and "Realisierbarkeit". We divided our team into three subgroups working on the topics data, model, and visualization (see figure "Teamaufteilung").
The main task of the data team was the embedding of the SBB data into the swiss energy planning app, where several nasty problems arose.
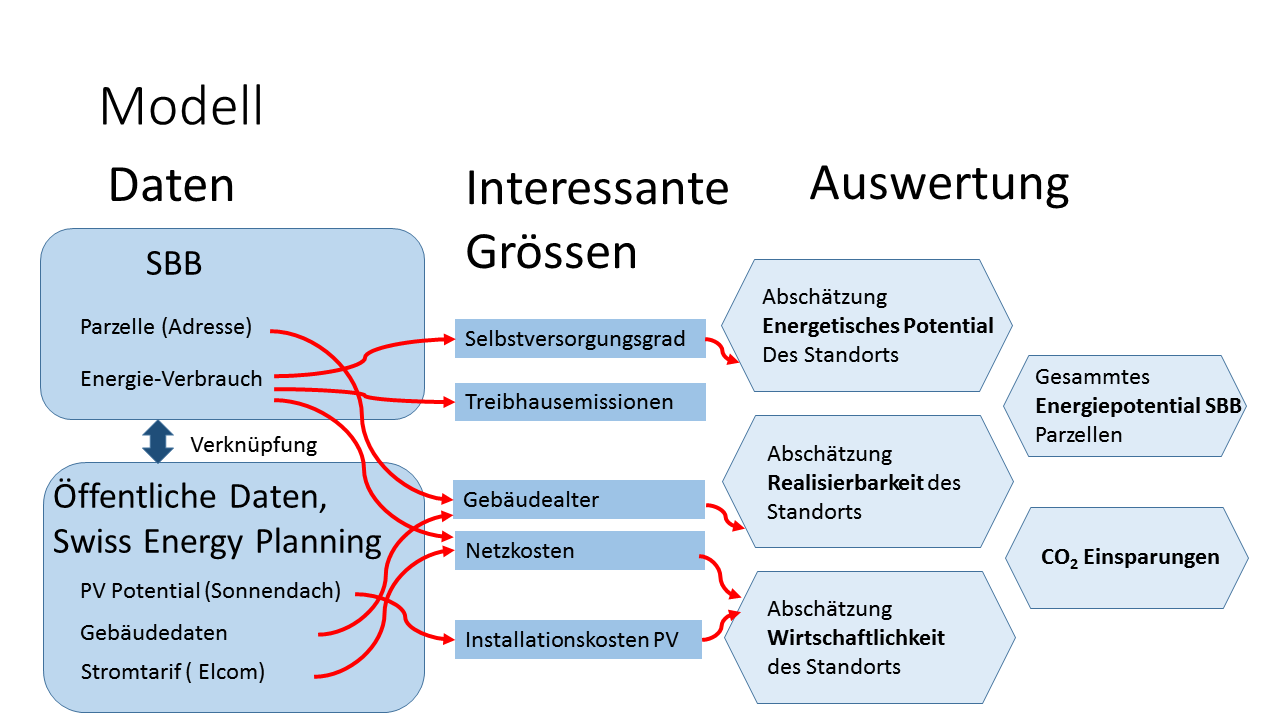
The model team developed a qualitative model based on quantitative data for assessing the potential of each SBB parcel (or potentially any cluster of parcels, see figure "Modell").
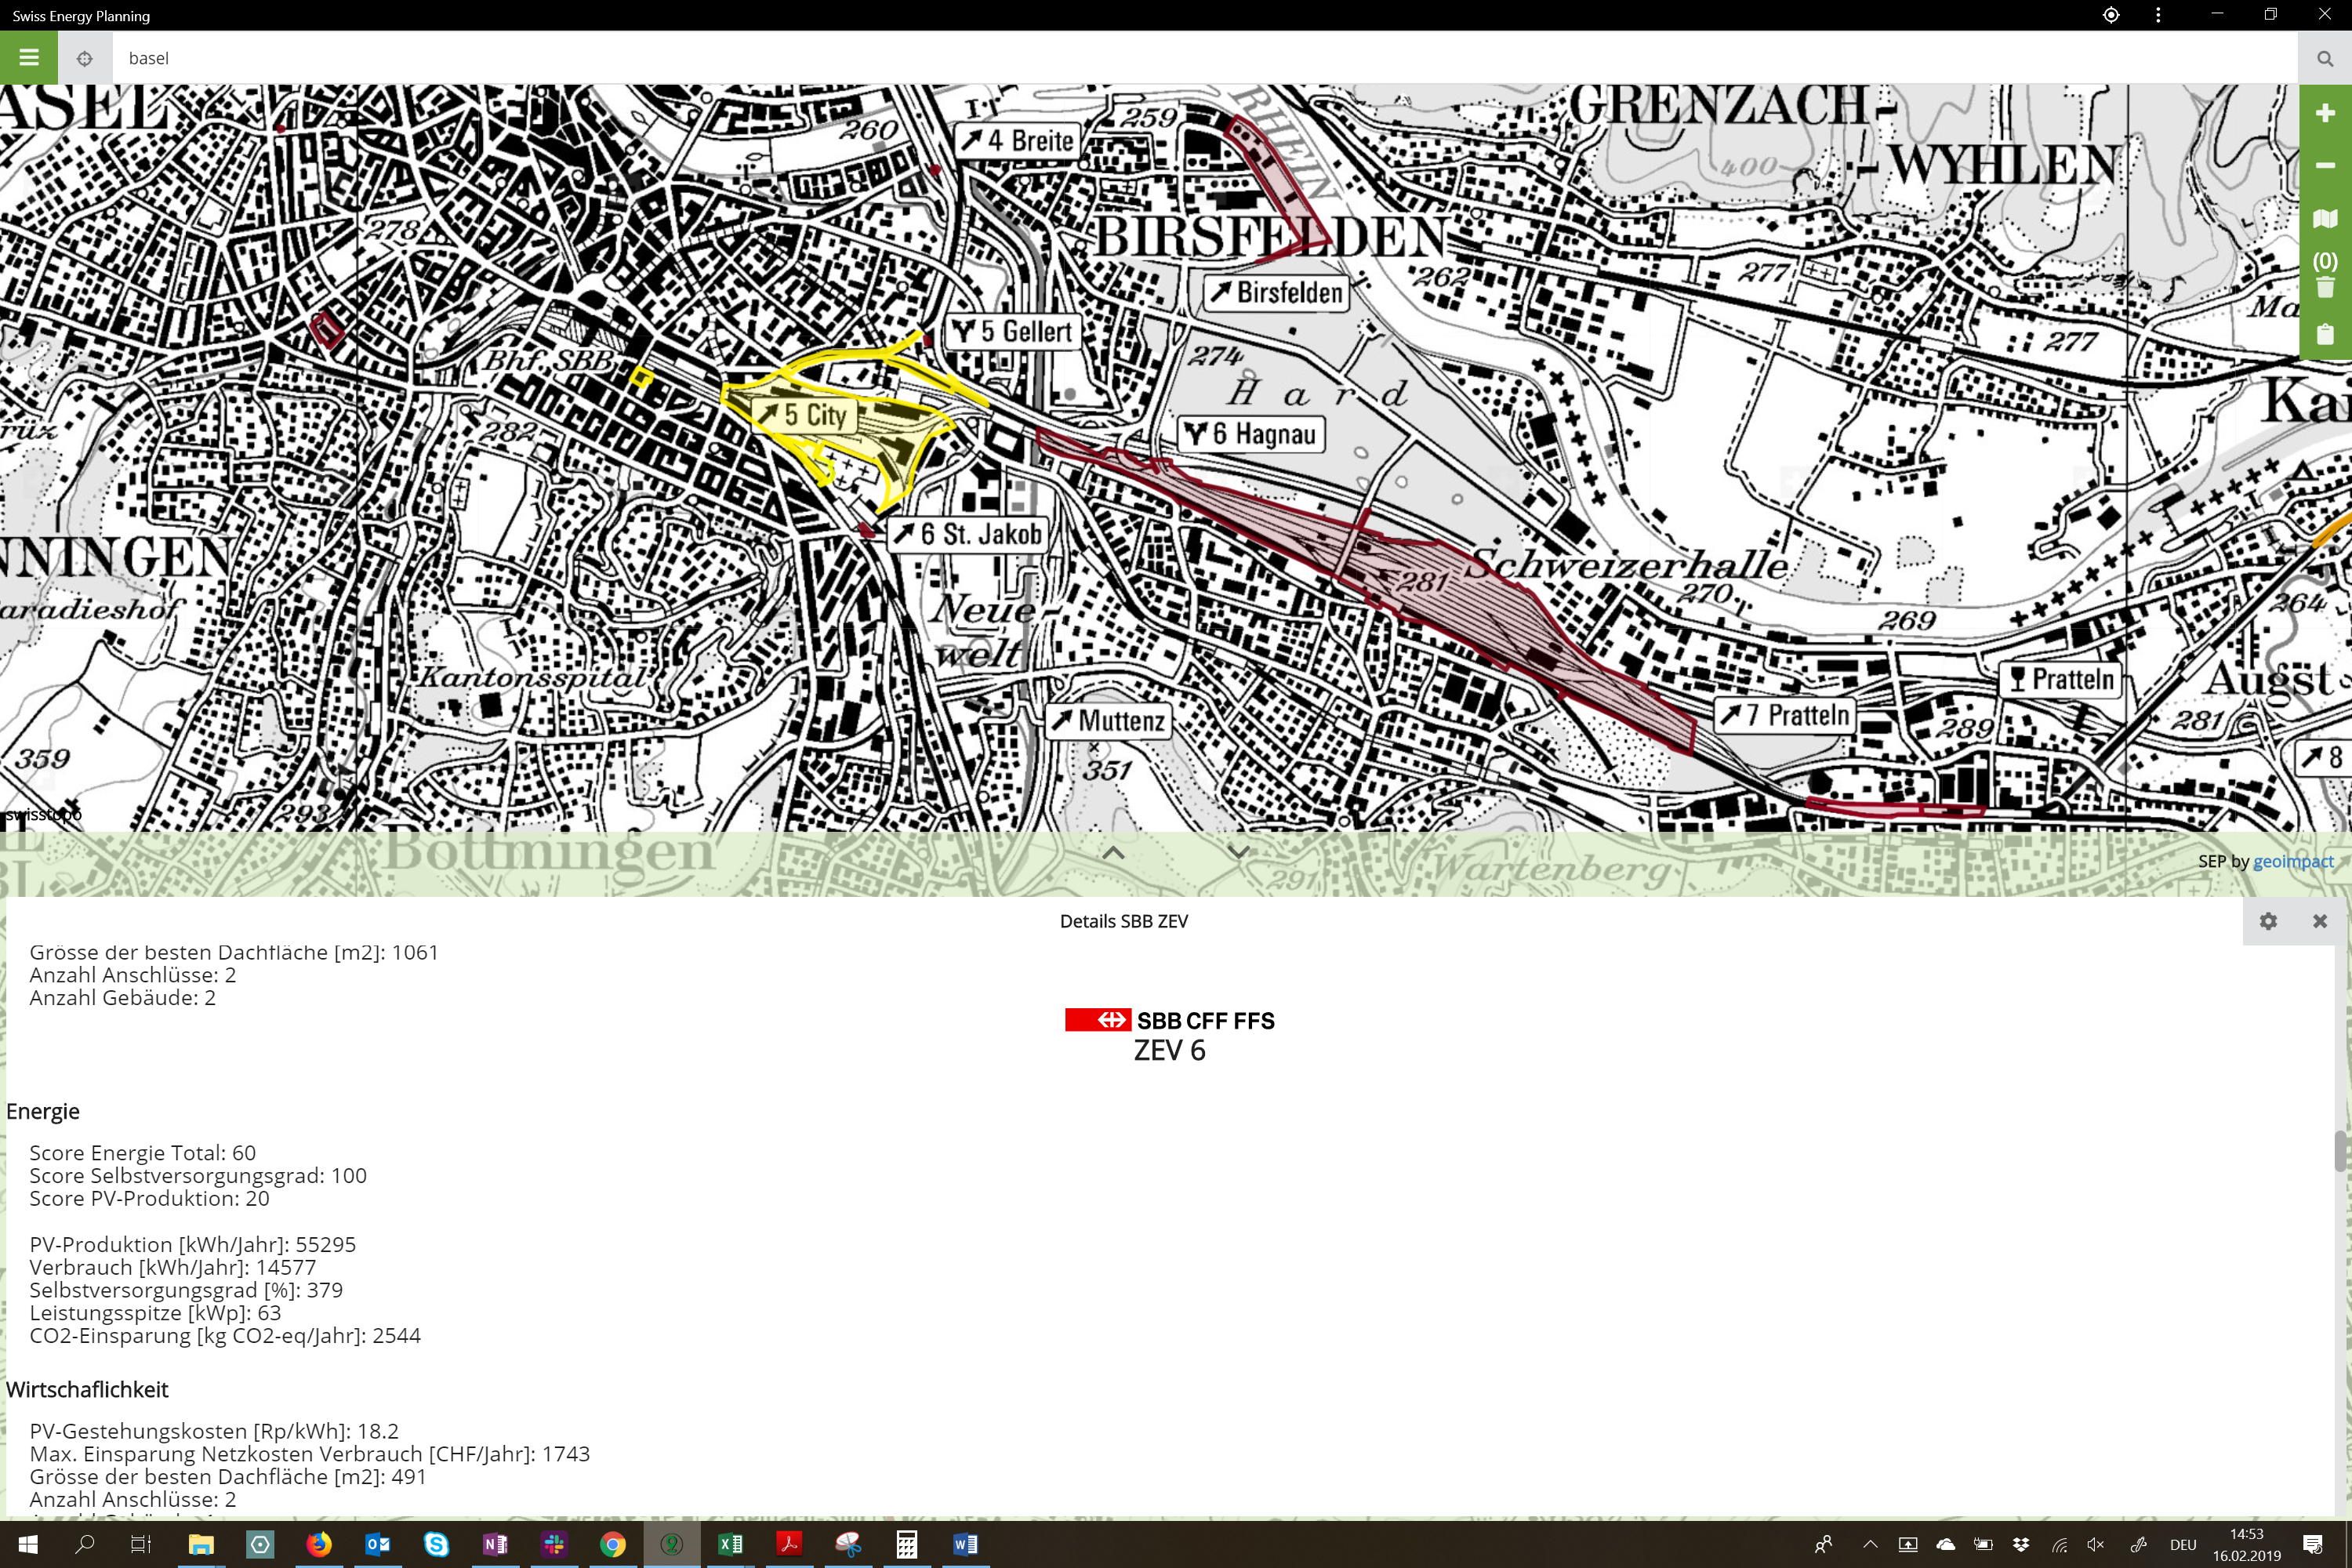
Finally, we visualized the potential assessment and all the information of interest for each parcel on a interactive map in the swiss energy planning app (see figure "Swiss Energy Planning").


