-
Notifications
You must be signed in to change notification settings - Fork 0
Reports
The global menu displays consolidated statistics.
Active sessions over time #
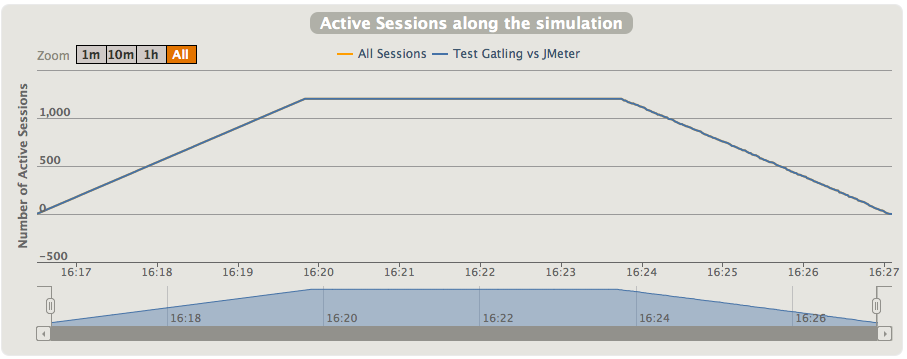
This chart displays the active users along the simulation : total and per scenario.
Total requests per second over time #
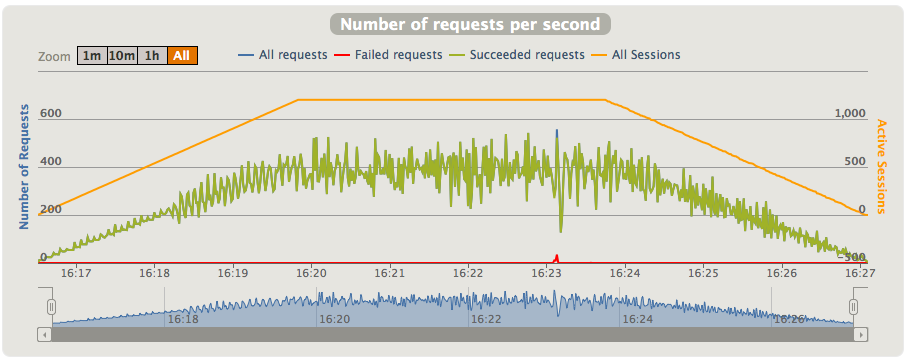
This chart displays the number of requests per second over time : total, successes and failures.
The details menu displays statistics per request.
Indicators #
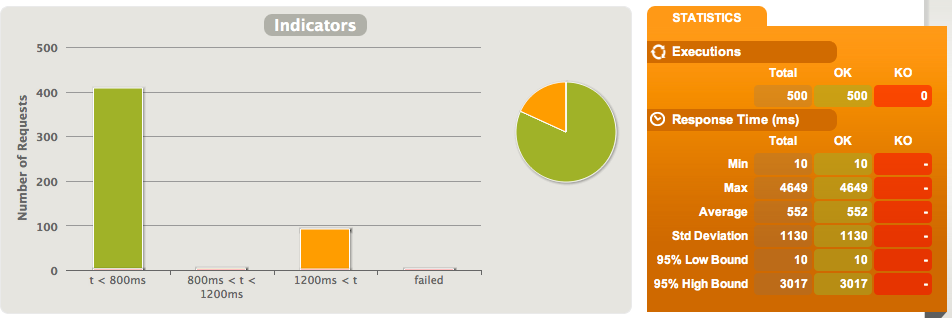
This chart shows response time are distributed among standard ranges.
Note: these ranges can be configured in the
gatling.conffile.
The right panel shows some standard statistics such as min, max, average and standard deviation. The percentiles stats show the range around the average where 95% of the response times are located.
Response Time over time #
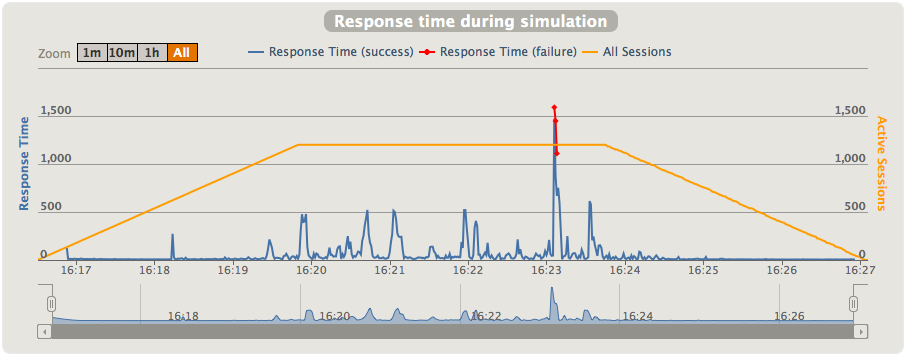
The response time is the duration between the beginning of the request emission and the end of the response reception. This chart shows the response time distribution over time for the given request.
Latency over time #
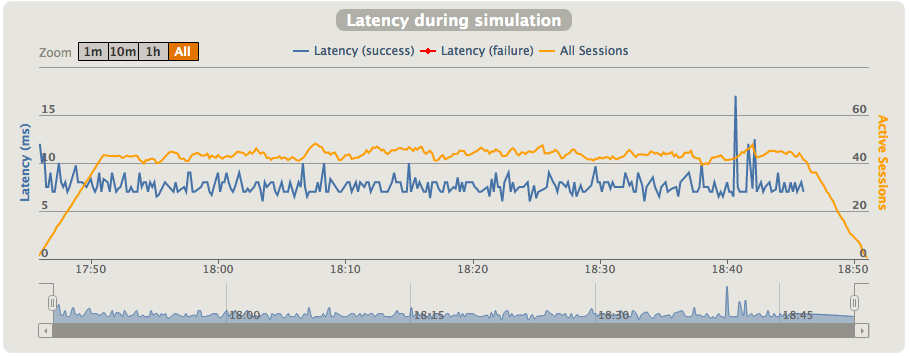
The latency is the duration between the end of the request emission and the beginning of the response reception. This chart shows the latency distribution over time for the given request.
Response Time over load #
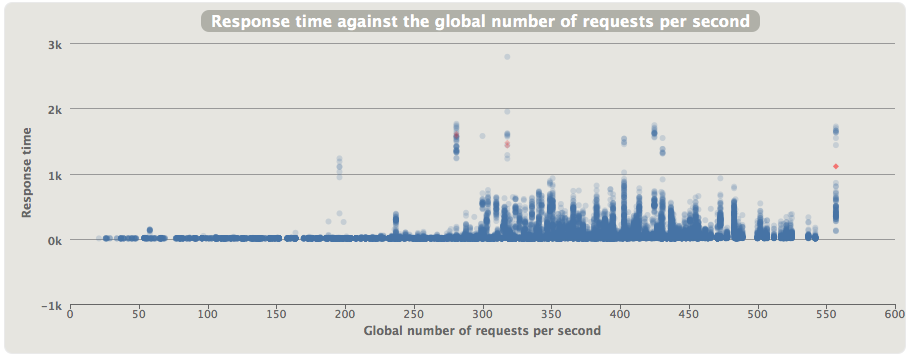
This chart shows how the response time for the given request is distributed, depending on the total load of the application at the same time.
- Introduction
- Underlying Technologies
- Concepts
- Benchmarks
- Sponsors
- Changelog
- Migrating
- License
- FAQ
- Contributing
- Links
- Tutorial
- Reference
- Cookbooks
- Retry
- Scaling out
- Passing parameters
- Webservices
- Extensions
- General information
- APIs
- Checks API
- Request API
- Charting API
- Feeder API