-
Notifications
You must be signed in to change notification settings - Fork 37
Renderer details
Most of the code in inst/htmljs/animint.js is under the main animint(to_select, json_file) function:
- to_select is a selector string that will be passed to d3.select. It defines where the plot will appear on the web page. For example I usually have just one div id="plot" so I write animint("#plot","plot.json") in inst/htmljs/index.html.
- json_file is the plot.json meta-data file that is written by the [compiler](Compiler details).
The first thing that the JavaScript code does is download the json meta-data file with d3.json(json_file). After the download completes, we call add_plot, add_legend, add_selector, add_geom for each of those objects.
- add_geom sets up the geom in Geoms and then calls update_geom.
- update_geom downloads the selected chunk of data or looks it up in chunks if it has already been downloaded. Then it calls draw_geom.
All the geom-specific code is located in draw_geom. So if you want to implement a new geom then most likely you just need to add something to draw_geom. There are really 2 types of geoms
- the data for most geoms are bound directly to corresponding SVG elements, like geom_point -> svg:circle, geom_rect -> svg:rect.
- geoms which become svg:path, like ribbons and lines. These have a group aesthetic in ggplot2 and we actually do a D3 data-bind of some path elements to some "fake" data, one for each group. All of the data goes into the "d" attribute.
The animint renderer starts by downloading the plot.json meta-data file. Once it has loaded, it will start downloading the data for the first selection.
- For animations, the data for the next animation frames will be downloaded transparently in the background, until all the data has been downloaded. This helps make the animation smooth (animation can be choppy if you have to wait for a download for each animation frame).
- For non-animated plots, animint.js only downloads the data required to show the selection onscreen. This means that for very large data sets you will probably never have to download all the chunks, since you probably will not look at all the data subsets.
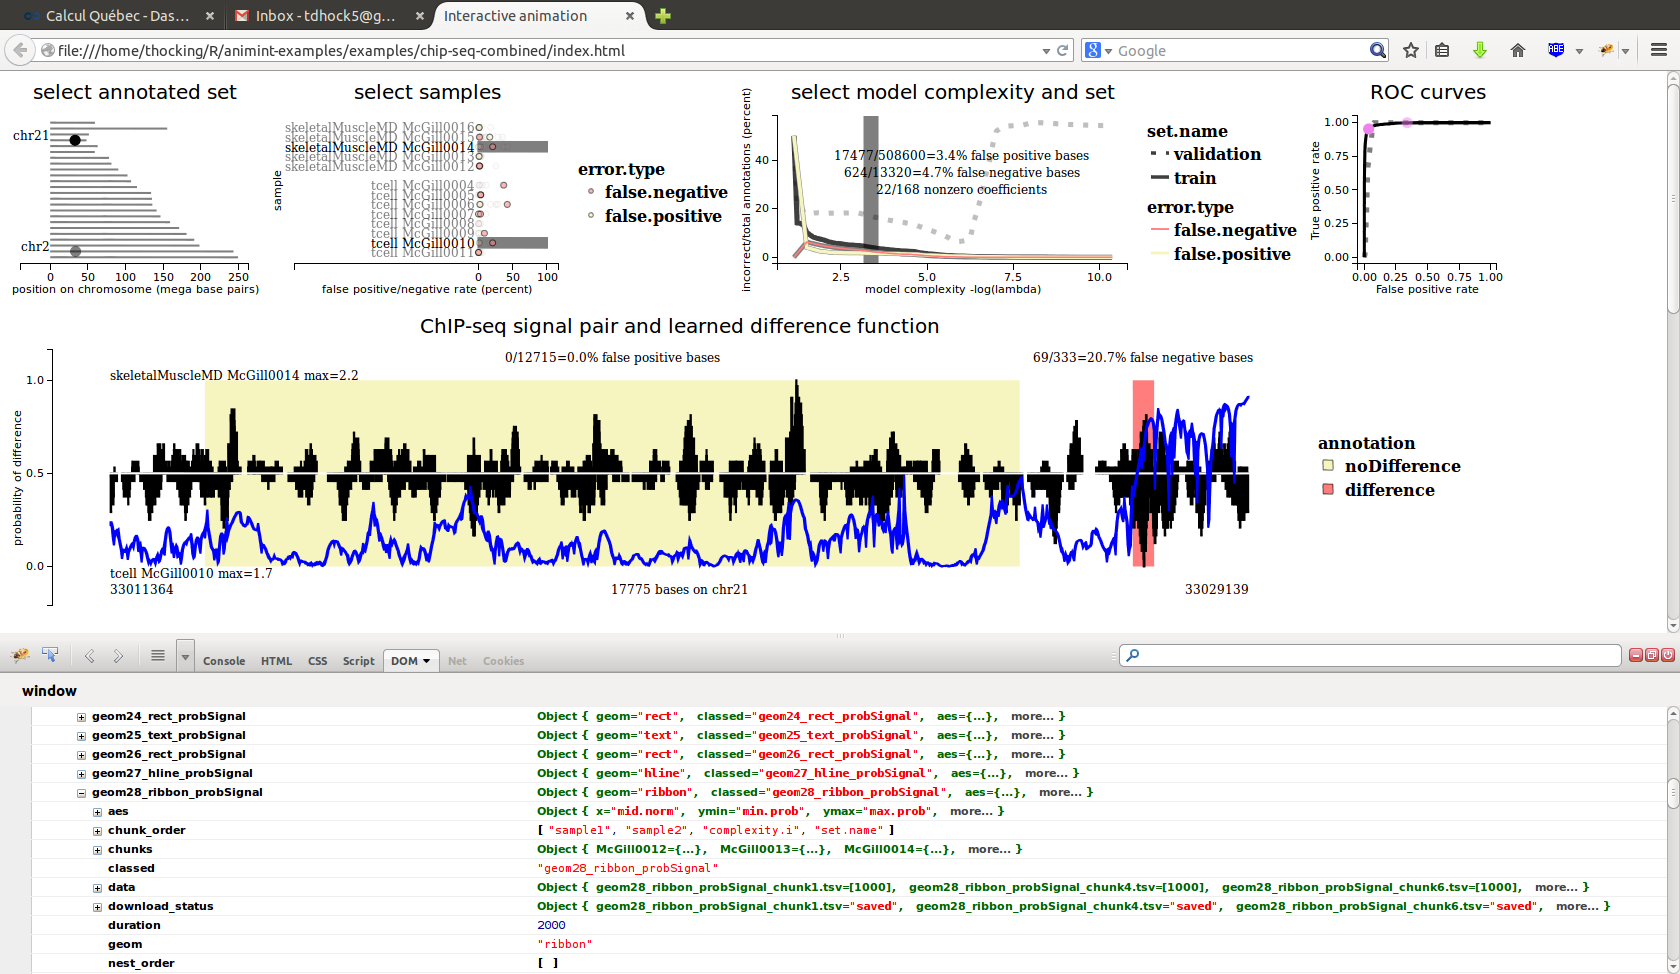
Use FireFox with FireBug to debug the animint.js JavaScript code.
- DOM tab: browse all the JavaScript plot data.
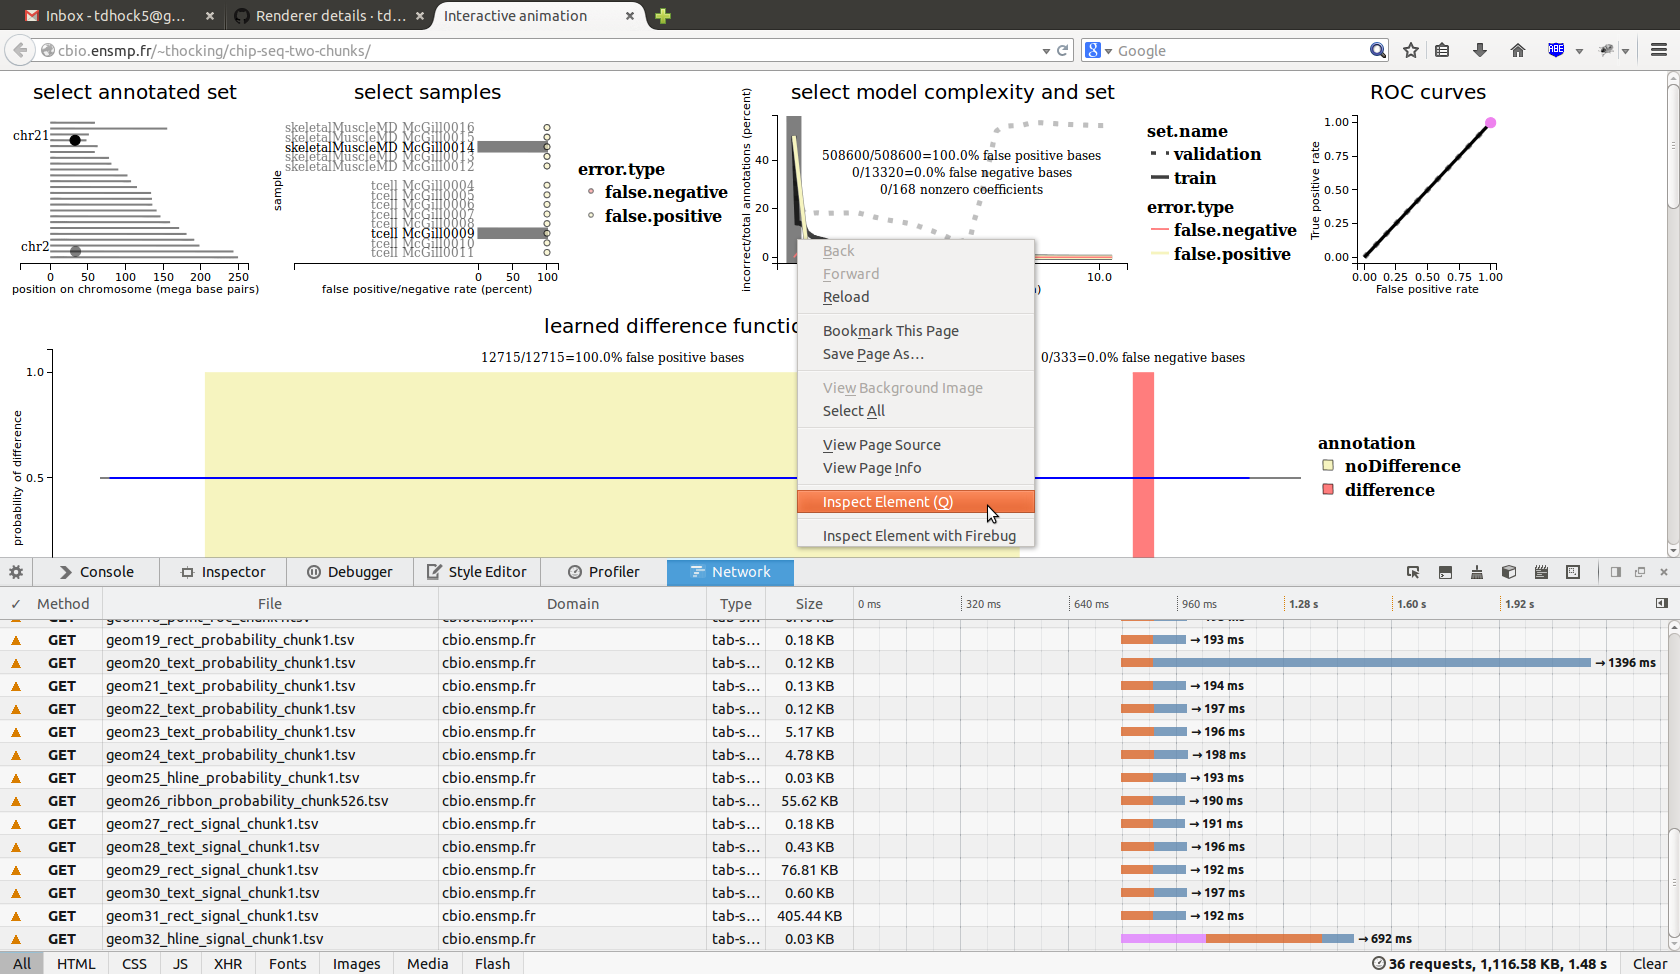
- HTML tab: see the correspondence between the HTML/SVG tags and the layout of items on the page. Also right click -> inspect element with firebug on anything onscreen to see its HTML.
- Script tab: insert breakpoints into the JavaScript code -- essential for debugging animint.js.
- Console tab: interactive shell for evaluating JavaScript code at the current breakpoint.

The "plot" object is where you can see a copy of the plot meta-data, and all the data downloaded so far for rendering purposes.
- Animation contains
- variable, the selector variable used for animation.
- ms, the number of milliseconds between each animation frame.
- next, a map from current value to next value of the selector variable.
- Geoms is a map from geom names to a map of geom/layer characteristics, each of which has
- aes, a map e.g. {"x":"percent", "clickSelects":"year"}.
- types, a map from aes names to animint variable types, e.g. {"fill":"rgb", "xmin":"numeric"}.
- classed is the same as the geom name, e.g. "geom2_scatter_point"
- chunk_order, nest_order, and subset_order are arrays of variable names, which seem to be similar, but are used for different purposes, so please do not confuse them:
- chunk_order is a list of selector names used to pull values when getting chunk ids out of the chunks map. For example chunk_order=["set.name"], Selectors["set.name"].selected="test", and chunks={"train":1, "test":2} means to look for chunk 2.
- nest_order is a list of aes names used with the D3 nest operator. This is only used right after downloading a chunk of data, before storing the chunk in data. Typically it contains "group" for ribbons and lines.
- subset_order is a list of aes names used to get downloaded data out of the data map. For example subset_order=["showSelected2"], aes={"showSelected2":"insert"}, Selectors.insert.selected="Virus2" and data={"geom15_text_insertScatter_chunk1246": {"Virus1":[...], "Virus2":[...]}}.
- chunks is a recursive map of selector values to integer chunk ids. the relevant selector variables are defined by chunk_order.
- data is a map of chunk file names to arrays of data to plot. the relevant selector variables are defined by subset_order.
- nextgeom defines the geom to draw after this geom.
- params is a map with data-independant but layer/geom-specific characteristics, e.g. {"color":"grey", "size":10}.
- select_style is either "opacity" or "stroke" and it designates how to show the current selection, but it is DEPRECATED and we should work to remove it as soon as possible. The NEWS file describes the replacement: e.g. geom_rect(selected.color="blue") or geom_point(selected.alpha=0.55) which gives the designer much more control.
- Some info about the download status to show in a summary table:
- download_status is a map of chunk file names to download status strings.
- total is an integer which is the total number of chunks that can be downloaded, useful for the download status table.
- tr is a D3 selection for the relevant row of the download status table.
- Widgets is a map containing non-data non-plot user interface Widgets.
- loading is the download status table.
- there eventually should be other stuff here when we implement drop-down menus for each selector.
- Selectors is a map from selector variable names to a map of
- selected is the currently selected value.
- geoms is an array of geom names to update after the value of this selector changes.
- SVGs is a map from geom names to SVG elements. When the plot is first rendered, we first call add_plot for every ggplot, and create an SVG element that each geom will draw on. Why don't we just create Geoms[geom_name].svg instead? Because add_geom is called after add_plot!
- Plots is a map from plot names to a map of plot-specific data:
- axis is a map of data used to draw the axes.
- geoms is an array of geom names used in this plot.
- legend is a map from legend name to a map of data used to draw that legend.
- options is a map of plot-specific options e.g. {"width":300}.
- title is a string, the title to display above the plot.
- element is the HTML element to which we add all the animint plot elements. Usually this is a div.
You can do this via right click - Inspect Element - Network in Firefox.

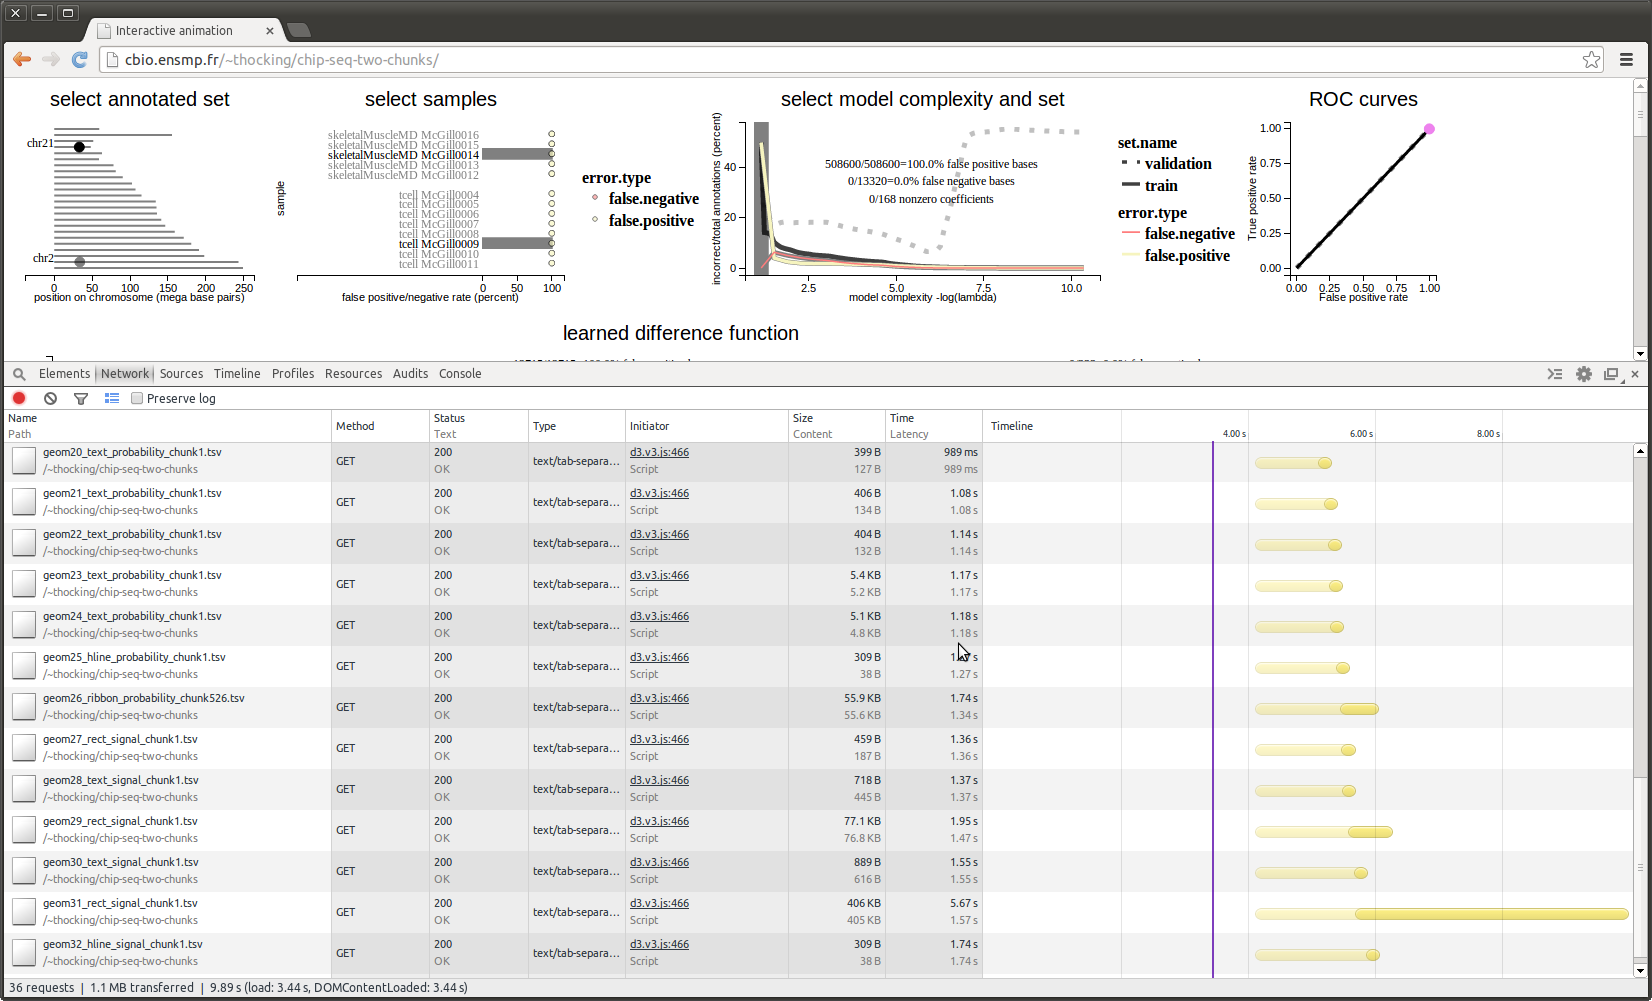
You can also do this in Chrome - right click - Inspect Element - Network.
