-
Notifications
You must be signed in to change notification settings - Fork 9
Characterization of polyploid genomes using k mer spectra analysis
Autoploids, and in this case specifically autotetraploids, have multiple copies of the same genome. This can happen when the genome doubles, and in the case of autotetraploids, there will be four copies of the genome. This differs from an allotetraploid (see the next tutorial), which is formed by two species hybridizing.
These two different polyploid events have distinct k-mer profiles. Take a look at these two histograms. Which to you think is an autotetraploid and which do you think is an allotetraploid?

- Lecture on YouTube: What's behind GenomeScope and Smudgeplot?
A short GenomeScope recap included within the introduction to Smudgeplot.
explanation
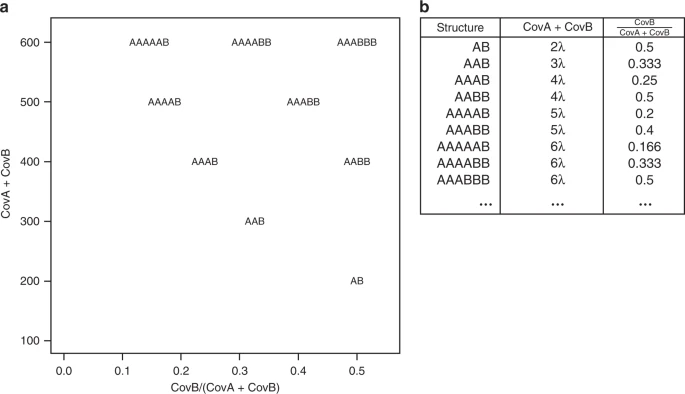
Sometimes, k-mer spectra is hard to read, figuring out which peak is which can be difficult. That is the reason why we developed smudgeplot - a tool that searches for all the unique k-mer pairs that differ in one nucleotide only. These are a mixed bag of pairs from heterozygous loci, and slightly diverged duplications. The pairs are then ploted on 2d density plot, with sum of their coverages as one axis and ratio as the other. The k-mer pairs of different ploidies will then project on different places as shown on the following diagram (lambda is the 1n coverage)
👆 Go back to Table of Content
👉 ⚒ Check out an example with an autotetraploid! Autotetraploid.
👉 📖 Read about modeling with k-mer spectra here Genome modeling as a quality control
Introduction
k-mer spectra analysis
- 📖 Introduction to K-mer spectra analysis
- 📖 Basics of genome modeling
- ⚒ manual model fitting (for better understanding of the underlying model)
- ⚒ simple diploid
- ⚒ demonstrating the effect of sequencing error rate on k-mer coverage
- 📖 Common difficulties in characterisation of diploid genomes using k mer spectra analysis
- ⚒ low coverage (pitfall) - to be merged
- ⚒ very homozygous diploid
- ⚒ highly heterozygous diploid
- ⚒ Genome size of a repetitive genome (pitfall)
- ⚒ Wrong ploidy (pitfall)
- 📖 Characterization of polyploid genomes using k mer spectra analysis
- ⚒ Autotetraploid
- ⚒ Allotetraploid
- ⚒ Estimating ploidy (smudgeplot)
- 📖 Genome modeling as a quality control
- ⚒ Contamination (pitfall)
- ⚒ k-mers in an assembly (Mercury/KAT)
- 📖 Analysing genome skimming data
Separation of chromosomes
- 📖Separate sub-genomes of an allopolyploid
- 📖Separating chromosomes by comparison of sequencing libraries
Species assignment using short k-mers
Others
