-
Notifications
You must be signed in to change notification settings - Fork 9
Genome size of a repetitive genome
Procambarus virginalis., the marbled crayfish is an asexual triploid with a supererepetitive genome. This is the reason why if fit the model to truncated k-mer spectrum, the estimated genome size is more than 1GB below the expected genome size. The monoploid size is known to be somewhere between 3 - 3.5 Gbp.
Let's try fitting a genome model to this crayfish dataset:
mkdir -p 01_crayfish

# Let's start with a default genomescope run using 17mers
genomescope.R -i data_for_genomescope/crayfish/P_virginalis_trimmed_turnicated_SRR5115143,SRR5115144,SRR5115145,SRR5115146,SRR5115147,SRR5115148_k17.hist -p 3 -k 17 -o 01_crayfish/ -n P_virginalis_trimmed_turnicated
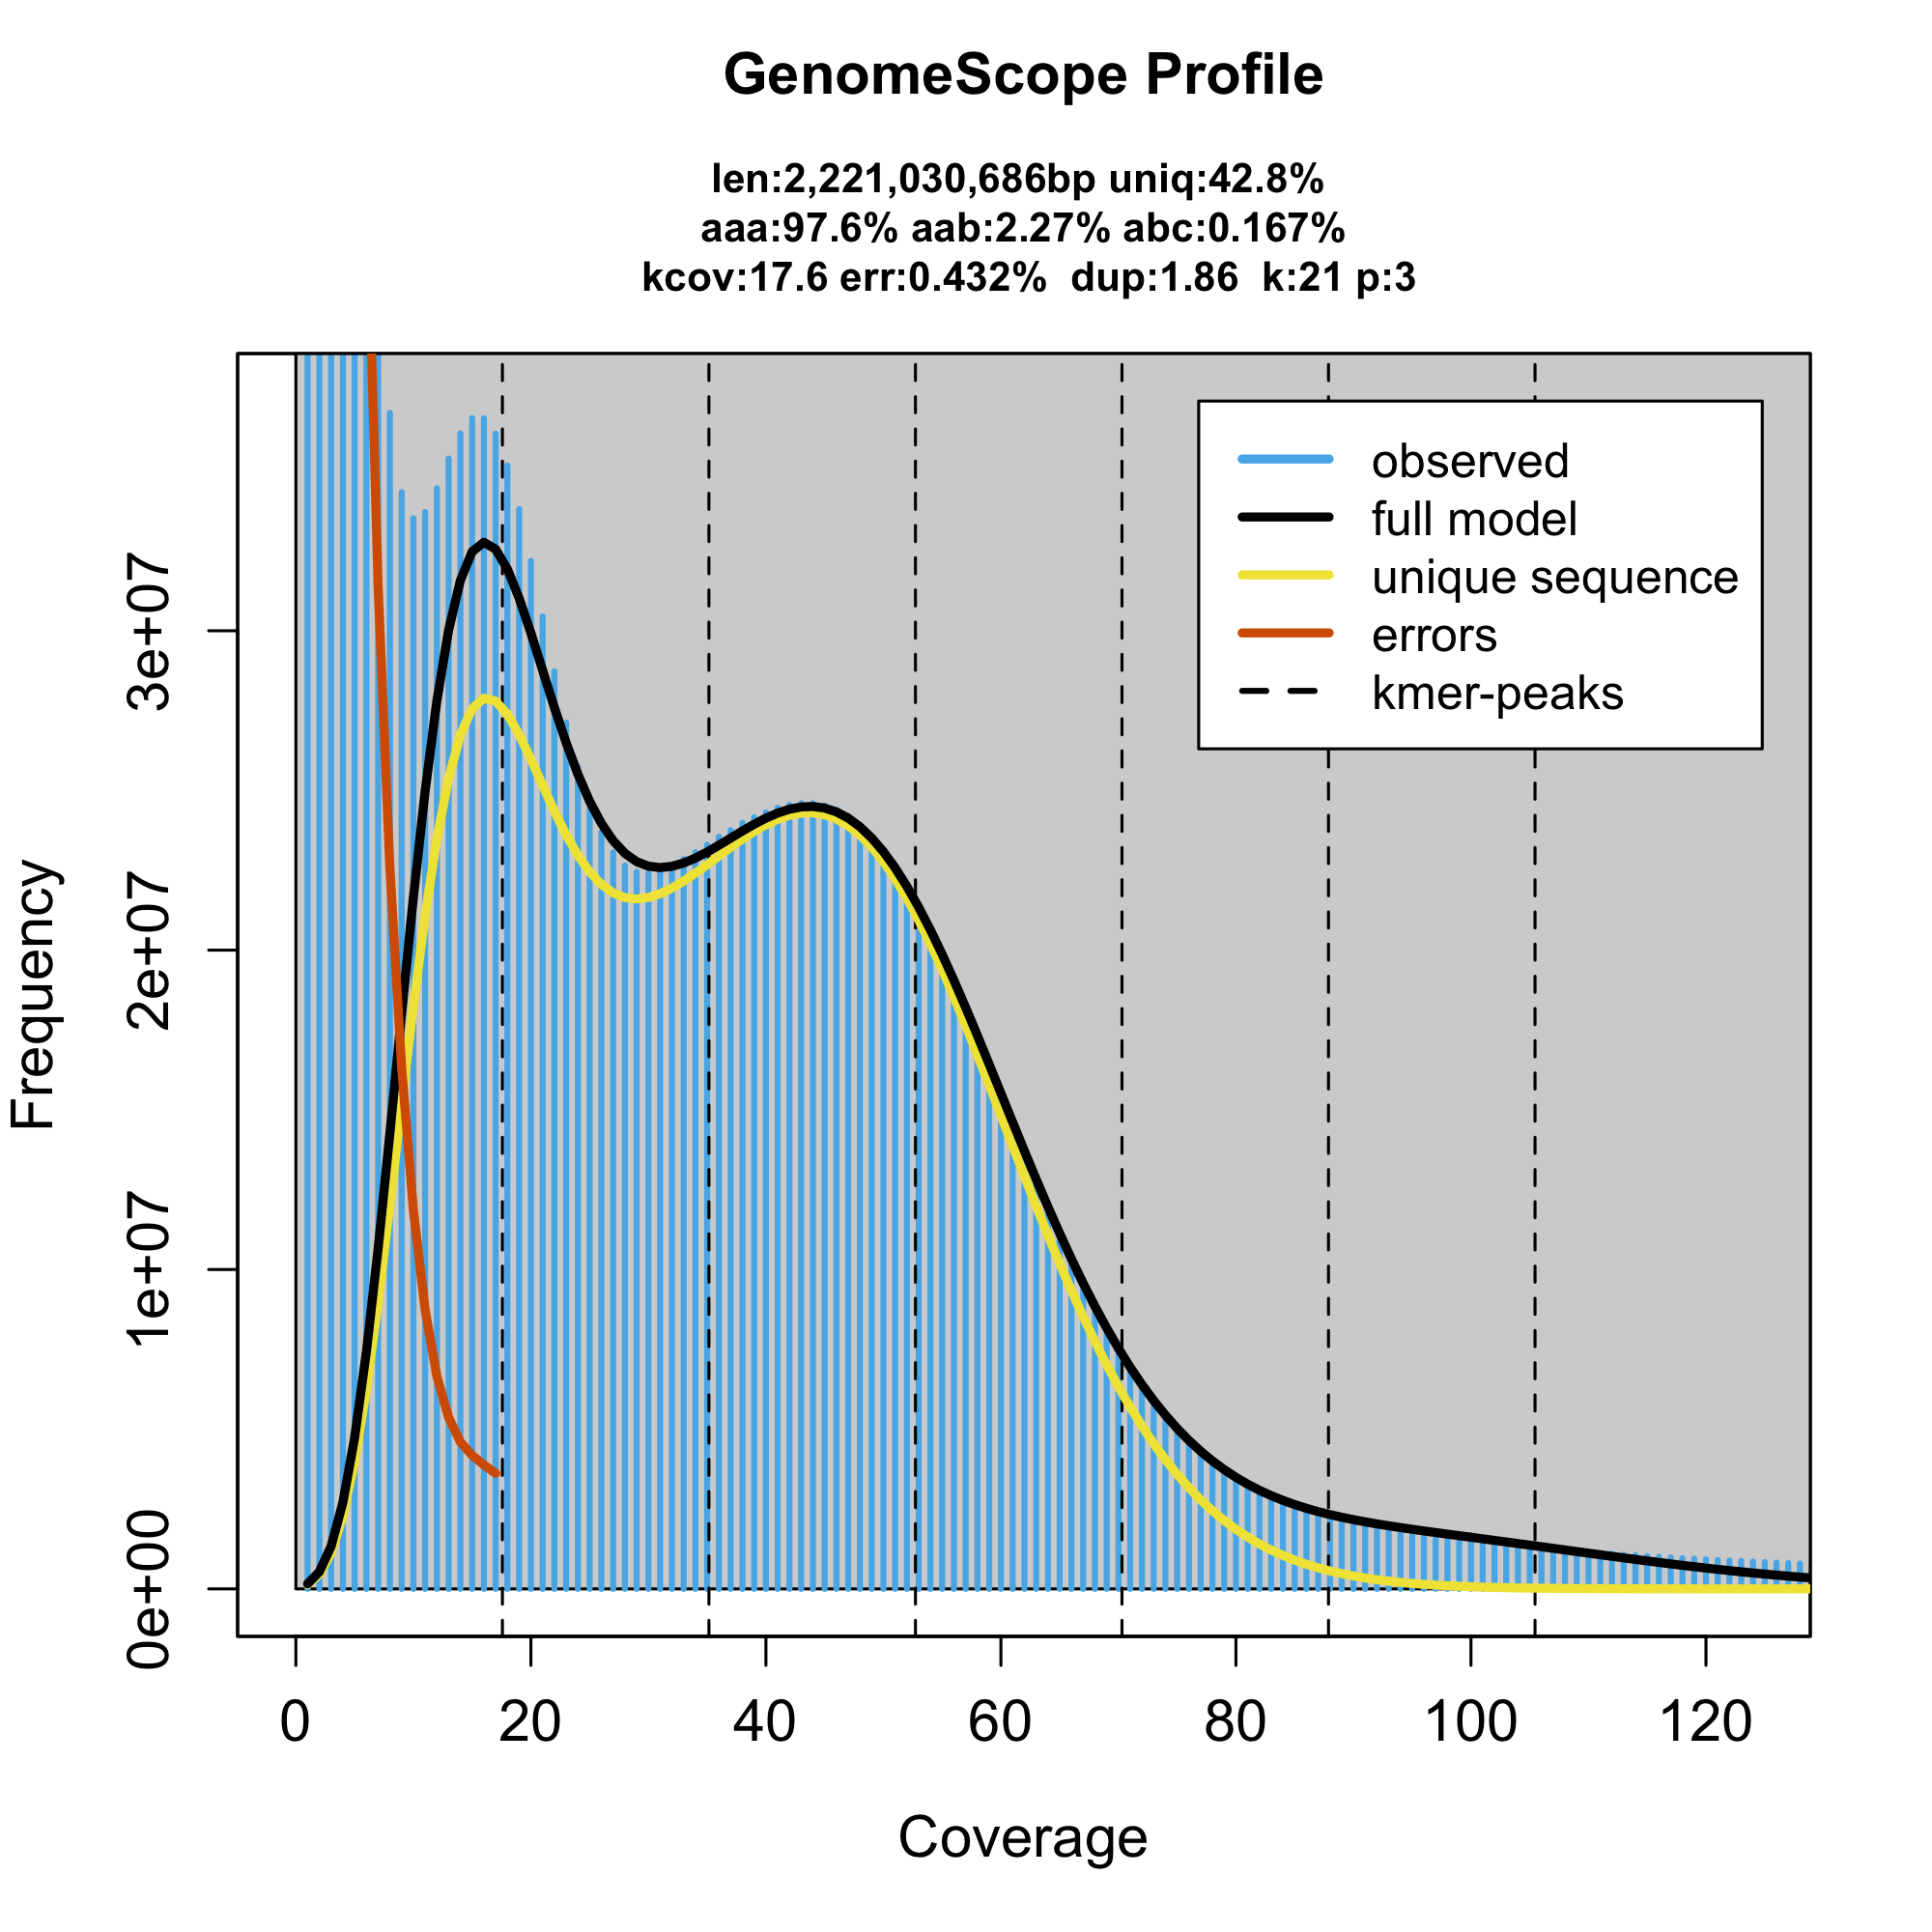
We get the following plot:
As we can see here, the model shows very high heteoryzogosity and a VERY small genome size, which we know is much higher. The genome assembly had the correct genome size, therefore we suspected that problem must be introduced somewhere on our side. As the genome size estimated only as a sum of all the genomic kmers divided by ploidy and haploid genome coverage, there are only two possible problems. Either the haploid coverage or the sum are wrong. While the coverage was in agreement with report in the genome assembly, the sum of kmer coverages was smaller than expected. Then we realized that the kmer counter we used (jellyfish) stops counting when it reaches coverage 10000, as kmers with this and higher are unlikely real genomic kmer, but rather adapters or contaminants. However, that applies only for small compact genomes, the crayfish repetitiveness might be, and it is, much higher.
Let's set a prior on the coverage to one third of previous fit 16x (quite often the real 1ns are 1/2 for diploid / tetraploid species and 1/3 for triploid species)
genomescope.R -i data_for_genomescope/crayfish/P_virginalis_trimmed_turnicated_SRR5115143,SRR5115144,SRR5115145,SRR5115146,SRR5115147,SRR5115148_k17.hist -p 3 -k 17 -l 17 -o 01_crayfish/ -n P_virginalis_trimmed_turnicated_l17

The genome size is still just 2.2G, which is a LOT less than what we would expect, let's see how counting all the kmers will help:
This would be the same model, but fit to a histogram that contains 200000 more rows with high all the supererepetitive kmers (coverage >10000x):
genomescope.R -i data_for_genomescope/crayfish/P_virginalis_trimmed_SRR5115143,SRR5115144,SRR5115145,SRR5115146,SRR5115147,SRR5115148_k17.hist -p 3 -k 17 -l 17 -o 01_crayfish/ -n P_virginalis_trimmed
See the difference in the genome size estimation? this is because now the model is including all those high-coverage kmers from the highly repetitive regions.
For comparison, you can also check, how much trimming the reads helped to clarify the kmer spectra by fitting the model to the raw kmer spectra
genomescope.R -i data_for_genomescope/crayfish/P_virginalis_raw_SRR5115143,SRR5115144,SRR5115145,SRR5115146,SRR5115147,SRR5115148_k17.hist -p 3 -k 17 -l 18 -o 01_crayfish/ -n P_virginalis_raw
What differences do you see between the two previous plots? Did you notice the "clean" reads have a narrower error peak? this allows better separation between "error" k-mers and true ones, and therefore give a better model fit.
Finally, we also provide a histogram of the diploid sister species P. fallax. This sequencing library is unfortunately with very low coverage and therefore the model does not converge on the right monoploid coverage without setting a prior. One truly hidden developer's trick for genomes with poor coverage is to add parameter --num_rounds=1 which somehow makes GenomeScope mimic GenomeScope v1, which works better on these low-coverge genomes. Check this twitter thread.
genomescope.R -i data_for_genomescope/crayfish/P_fallax_SRR5115152_k17_full.hist -p 2 -k 17 -o 01_crayfish/ -n P_fallax --num_rounds=1
The model says the haploid size is 1.75Gbp, which is about half what we expected, let's also fit a model with smaller prior on coverage
genomescope.R -i data_for_genomescope/crayfish/P_fallax_SRR5115152_k17_full.hist -p 2 -k 17 -l 15 -o 01_crayfish/ -n P_fallax_l15 --num_rounds=1

This is more like it!
Bonus question: It has been suggested the clonal marbled crayfish turned asexual due to autopolyploidization. Do you think it's plausible/parsimonious given the values of heterozygosities you see?
Let's go over the last example of things that can mess with your model fit. Next we will play with the ploidy levels.
👆 Go back to Table of Content
👉 ⚒ Fit some models of unknown ploidy level organisms here.
👉 📖 Read about Characterization of polyploid genomes using k mer spectra analysis].
Introduction
k-mer spectra analysis
- 📖 Introduction to K-mer spectra analysis
- 📖 Basics of genome modeling
- ⚒ manual model fitting (for better understanding of the underlying model)
- ⚒ simple diploid
- ⚒ demonstrating the effect of sequencing error rate on k-mer coverage
- 📖 Common difficulties in characterisation of diploid genomes using k mer spectra analysis
- ⚒ low coverage (pitfall) - to be merged
- ⚒ very homozygous diploid
- ⚒ highly heterozygous diploid
- ⚒ Genome size of a repetitive genome (pitfall)
- ⚒ Wrong ploidy (pitfall)
- 📖 Characterization of polyploid genomes using k mer spectra analysis
- ⚒ Autotetraploid
- ⚒ Allotetraploid
- ⚒ Estimating ploidy (smudgeplot)
- 📖 Genome modeling as a quality control
- ⚒ Contamination (pitfall)
- ⚒ k-mers in an assembly (Mercury/KAT)
- 📖 Analysing genome skimming data
Separation of chromosomes
- 📖Separate sub-genomes of an allopolyploid
- 📖Separating chromosomes by comparison of sequencing libraries
Species assignment using short k-mers
Others
